Zip Codes with the Highest Percentage of Population Employed in Arts, Entertainment & Recreation in Lynn, MA
RELATED REPORTS & OPTIONS
Arts, Entertainment & Recreation
Lynn
Compare Zip Codes
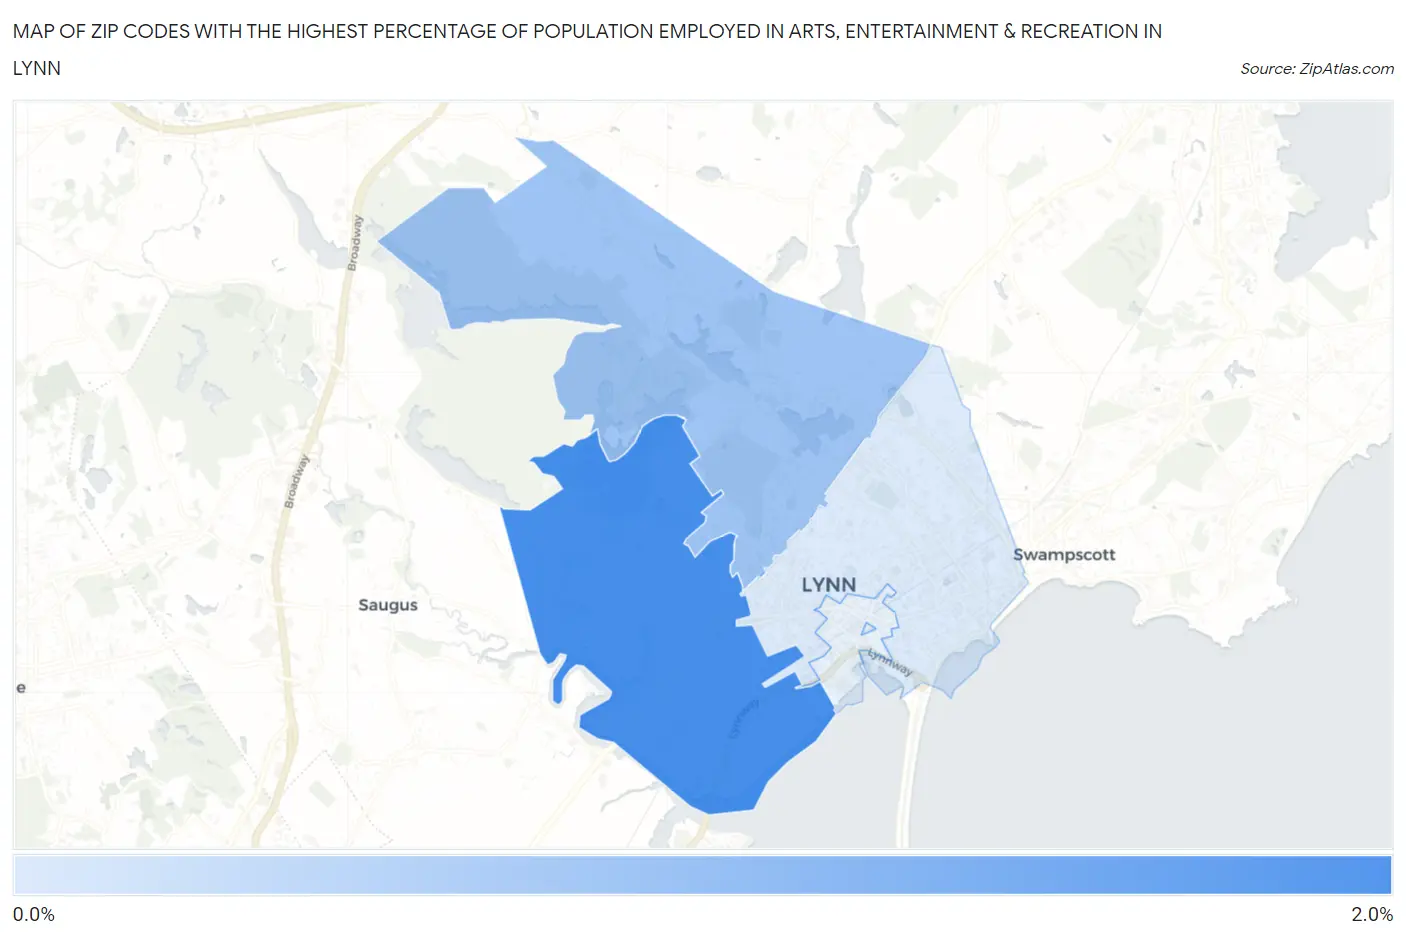
Map of Zip Codes with the Highest Percentage of Population Employed in Arts, Entertainment & Recreation in Lynn
0.0%
2.0%
Zip Codes with the Highest Percentage of Population Employed in Arts, Entertainment & Recreation in Lynn, MA
| Zip Code | % Employed | vs State | vs National | |
| 1. | 01905 | 1.9% | 2.0%(-0.052)#243 | 2.1%(-0.156)#10,218 |
| 2. | 01904 | 1.1% | 2.0%(-0.917)#398 | 2.1%(-1.02)#16,538 |
| 3. | 01902 | 0.46% | 2.0%(-1.52)#463 | 2.1%(-1.62)#20,741 |
1
Common Questions
What are the Top 3 Zip Codes with the Highest Percentage of Population Employed in Arts, Entertainment & Recreation in Lynn, MA?
Top 3 Zip Codes with the Highest Percentage of Population Employed in Arts, Entertainment & Recreation in Lynn, MA are:
What zip code has the Highest Percentage of Population Employed in Arts, Entertainment & Recreation in Lynn, MA?
01905 has the Highest Percentage of Population Employed in Arts, Entertainment & Recreation in Lynn, MA with 1.9%.
What is the Percentage of Population Employed in Arts, Entertainment & Recreation in Lynn, MA?
Percentage of Population Employed in Arts, Entertainment & Recreation in Lynn is 1.00%.
What is the Percentage of Population Employed in Arts, Entertainment & Recreation in Massachusetts?
Percentage of Population Employed in Arts, Entertainment & Recreation in Massachusetts is 2.0%.
What is the Percentage of Population Employed in Arts, Entertainment & Recreation in the United States?
Percentage of Population Employed in Arts, Entertainment & Recreation in the United States is 2.1%.