Tlingit-Haida vs Immigrants from England In Labor Force | Age > 16

COMPARE

Tlingit-Haida
Race
Ancestry
AfghanAfricanAlaska NativeAlaskan AthabascanAlbanianAleutAlsatianAmericanApacheArabArapahoArgentineanArmenianAssyrian/Chaldean/SyriacAustralianAustrianBahamianBangladeshiBarbadianBasqueBelgianBelizeanBermudanBhutaneseBlackfeetBolivianBrazilianBritishBritish West IndianBulgarianBurmeseCajunCambodianCanadianCape VerdeanCarpatho RusynCelticCentral AmericanCentral American IndianCherokeeCheyenneChickasawChileanChineseChippewaChoctawColombianColvilleComancheCosta RicanCreeCreekCroatianCrowCubanCypriotCzechCzechoslovakianDanishDelawareDominicanDutchDutch West IndianEastern EuropeanEcuadorianEgyptianEnglishEstonianEthiopianEuropeanFijianFilipinoFinnishFrenchFrench American IndianFrench CanadianGermanGerman RussianGhanaianGreekGuamanian/ChamorroGuatemalanGuyaneseHaitianHmongHonduranHopiHoumaHungarianIcelanderIndian (Asian)IndonesianInupiatIranianIraqiIrishIroquoisIsraeliItalianJamaicanJapaneseJordanianKenyanKiowaKoreanLaotianLatvianLebaneseLiberianLithuanianLumbeeLuxembourgerMacedonianMalaysianMalteseMarshalleseMenomineeMexicanMexican American IndianMongolianMoroccanNative HawaiianNavajoNepaleseNew ZealanderNicaraguanNigerianNorthern EuropeanNorwegianOkinawanOsageOttawaPaiutePakistaniPalestinianPanamanianParaguayanPennsylvania GermanPeruvianPimaPolishPortuguesePotawatomiPuebloPuerto RicanPuget Sound SalishRomanianRussianSalvadoranSamoanScandinavianScotch-IrishScottishSeminoleSenegaleseSerbianShoshoneSierra LeoneanSiouxSlavicSlovakSloveneSomaliSouth AfricanSouth AmericanSouth American IndianSoviet UnionSpaniardSpanishSpanish AmericanSpanish American IndianSri LankanSubsaharan AfricanSudaneseSwedishSwissSyrianTaiwaneseThaiTlingit-HaidaTohono O'OdhamTonganTrinidadian and TobagonianTsimshianTurkishU.S. Virgin IslanderUgandanUkrainianUruguayanUteVenezuelanVietnameseWelshWest IndianYakamaYaquiYugoslavianYumanYup'ikZimbabwean
Immigration
NonimmigrantsImmigrantsAfghanistanAfricaAlbaniaArgentinaArmeniaAsiaAustraliaAustriaBahamasBangladeshBarbadosBelarusBelgiumBelizeBoliviaBosnia and HerzegovinaBrazilBulgariaBurma/MyanmarCabo VerdeCambodiaCameroonCanadaCaribbeanCentral AmericaChileChinaColombiaCongoCosta RicaCroatiaCubaCzechoslovakiaDenmarkDominicaDominican RepublicEastern AfricaEastern AsiaEastern EuropeEcuadorEgyptEl SalvadorEritreaEthiopiaEuropeFijiFranceGermanyGhanaGreeceGrenadaGuatemalaGuyanaHaitiHondurasHong KongHungaryIndiaIndonesiaIranIraqIrelandIsraelItalyJamaicaJapanJordanKazakhstanKenyaKoreaKuwaitLaosLatin AmericaLatviaLebanonLiberiaLithuaniaMalaysiaMexicoMicronesiaMiddle AfricaMoldovaMoroccoNepalNetherlandsNicaraguaNigeriaNorth AmericaNorth MacedoniaNorthern AfricaNorthern EuropeNorwayOceaniaPakistanPanamaPeruPhilippinesPolandPortugalRomaniaRussiaSaudi ArabiaScotlandSenegalSerbiaSierra LeoneSingaporeSomaliaSouth AfricaSouth AmericaSouth Central AsiaSouth Eastern AsiaSouthern EuropeSpainSri LankaSt. Vincent and the GrenadinesSudanSwedenSwitzerlandSyriaTaiwanThailandTrinidad and TobagoTurkeyUgandaUkraineUruguayUzbekistanVenezuelaVietnamWest IndiesWestern AfricaWestern AsiaWestern EuropeYemenZaireZimbabweAzores
Immigrants from England
Race
Ancestry
AfghanAfricanAlaska NativeAlaskan AthabascanAlbanianAleutAlsatianAmericanApacheArabArapahoArgentineanArmenianAssyrian/Chaldean/SyriacAustralianAustrianBahamianBangladeshiBarbadianBasqueBelgianBelizeanBermudanBhutaneseBlackfeetBolivianBrazilianBritishBritish West IndianBulgarianBurmeseCajunCambodianCanadianCape VerdeanCarpatho RusynCelticCentral AmericanCentral American IndianCherokeeCheyenneChickasawChileanChineseChippewaChoctawColombianColvilleComancheCosta RicanCreeCreekCroatianCrowCubanCypriotCzechCzechoslovakianDanishDelawareDominicanDutchDutch West IndianEastern EuropeanEcuadorianEgyptianEnglishEstonianEthiopianEuropeanFijianFilipinoFinnishFrenchFrench American IndianFrench CanadianGermanGerman RussianGhanaianGreekGuamanian/ChamorroGuatemalanGuyaneseHaitianHmongHonduranHopiHoumaHungarianIcelanderIndian (Asian)IndonesianInupiatIranianIraqiIrishIroquoisIsraeliItalianJamaicanJapaneseJordanianKenyanKiowaKoreanLaotianLatvianLebaneseLiberianLithuanianLumbeeLuxembourgerMacedonianMalaysianMalteseMarshalleseMenomineeMexicanMexican American IndianMongolianMoroccanNative HawaiianNavajoNepaleseNew ZealanderNicaraguanNigerianNorthern EuropeanNorwegianOkinawanOsageOttawaPaiutePakistaniPalestinianPanamanianParaguayanPennsylvania GermanPeruvianPimaPolishPortuguesePotawatomiPuebloPuerto RicanPuget Sound SalishRomanianRussianSalvadoranSamoanScandinavianScotch-IrishScottishSeminoleSenegaleseSerbianShoshoneSierra LeoneanSiouxSlavicSlovakSloveneSomaliSouth AfricanSouth AmericanSouth American IndianSoviet UnionSpaniardSpanishSpanish AmericanSpanish American IndianSri LankanSubsaharan AfricanSudaneseSwedishSwissSyrianTaiwaneseThaiTohono O'OdhamTonganTrinidadian and TobagonianTsimshianTurkishU.S. Virgin IslanderUgandanUkrainianUruguayanUteVenezuelanVietnameseWelshWest IndianYakamaYaquiYugoslavianYumanYup'ikZimbabwean
Immigration
NonimmigrantsImmigrantsAfghanistanAfricaAlbaniaArgentinaArmeniaAsiaAustraliaAustriaBahamasBangladeshBarbadosBelarusBelgiumBelizeBoliviaBosnia and HerzegovinaBrazilBulgariaBurma/MyanmarCabo VerdeCambodiaCameroonCanadaCaribbeanCentral AmericaChileChinaColombiaCongoCosta RicaCroatiaCubaCzechoslovakiaDenmarkDominicaDominican RepublicEastern AfricaEastern AsiaEastern EuropeEcuadorEgyptEl SalvadorEnglandEritreaEthiopiaEuropeFijiFranceGermanyGhanaGreeceGrenadaGuatemalaGuyanaHaitiHondurasHong KongHungaryIndiaIndonesiaIranIraqIrelandIsraelItalyJamaicaJapanJordanKazakhstanKenyaKoreaKuwaitLaosLatin AmericaLatviaLebanonLiberiaLithuaniaMalaysiaMexicoMicronesiaMiddle AfricaMoldovaMoroccoNepalNetherlandsNicaraguaNigeriaNorth AmericaNorth MacedoniaNorthern AfricaNorthern EuropeNorwayOceaniaPakistanPanamaPeruPhilippinesPolandPortugalRomaniaRussiaSaudi ArabiaScotlandSenegalSerbiaSierra LeoneSingaporeSomaliaSouth AfricaSouth AmericaSouth Central AsiaSouth Eastern AsiaSouthern EuropeSpainSri LankaSt. Vincent and the GrenadinesSudanSwedenSwitzerlandSyriaTaiwanThailandTrinidad and TobagoTurkeyUgandaUkraineUruguayUzbekistanVenezuelaVietnamWest IndiesWestern AfricaWestern AsiaWestern EuropeYemenZaireZimbabweAzores
In Labor Force | Age > 16
Income
Poverty
Unemployment
Labor Participation
Family Structure
Vehicle Availability
Education Level
Disability

In Labor Force | Age > 16 Comparison

Tlingit-Haida

Immigrants from England

Excellent
Tragic
65.5%
IN LABOR FORCE | AGE > 16
88.3/ 100
METRIC RATING
145th/ 347
METRIC RANK
64.2%
IN LABOR FORCE | AGE > 16
0.5/ 100
METRIC RATING
266th/ 347
METRIC RANK

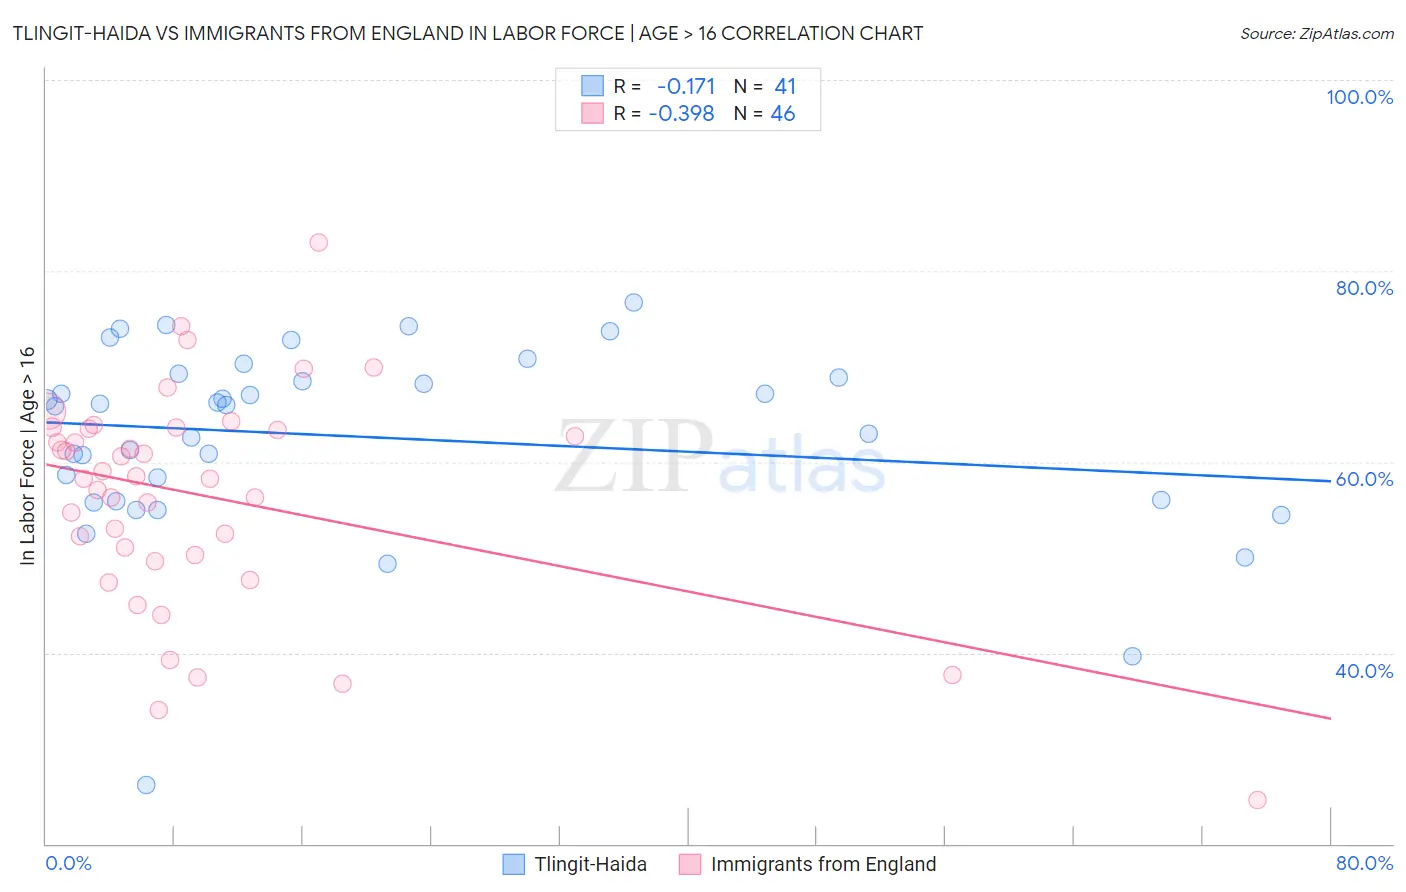
Tlingit-Haida vs Immigrants from England In Labor Force | Age > 16 Correlation Chart

The statistical analysis conducted on geographies consisting of 60,871,082 people shows a poor negative correlation between the proportion of Tlingit-Haida and labor force participation rate among population ages 16 and over in the United States with a correlation coefficient (R) of -0.171 and weighted average of 65.5%. Similarly, the statistical analysis conducted on geographies consisting of 391,897,781 people shows a mild negative correlation between the proportion of Immigrants from England and labor force participation rate among population ages 16 and over in the United States with a correlation coefficient (R) of -0.398 and weighted average of 64.2%, a difference of 2.1%.
Tlingit-Haida vs Immigrants from England In Labor Force | Age > 16

In Labor Force | Age > 16 Correlation Summary

MeasurementTlingit-HaidaImmigrants from England
Minimum26.2%24.6%
Maximum76.7%83.0%
Range50.5%58.4%
Mean62.7%56.4%
Median66.0%58.3%
Interquartile 25% (IQ1)56.0%50.2%
Interquartile 75% (IQ3)69.1%63.5%
Interquartile Range (IQR)13.1%13.3%
Standard Deviation (Sample)10.0%11.5%
Standard Deviation (Population)9.9%11.3%

Similar Demographics by In Labor Force | Age > 16

Demographics Similar to Tlingit-Haida by In Labor Force | Age > 16

In terms of in labor force | age > 16, the demographic groups most similar to Tlingit-Haida are Cypriot (65.5%, a difference of 0.0%), Immigrants from Romania (65.5%, a difference of 0.010%), Immigrants from Oceania (65.5%, a difference of 0.020%), Indian (Asian) (65.5%, a difference of 0.030%), and Latvian (65.5%, a difference of 0.030%).
DemographicsRating | RankIn Labor Force | Age > 16
Immigrants | West Indies
92.0
/100
|
#138
Exceptional
65.6%
Immigrants | Taiwan
90.8
/100
|
#139
Exceptional
65.5%
Immigrants | Costa Rica
90.8
/100
|
#140
Exceptional
65.5%
Samoans
90.5
/100
|
#141
Exceptional
65.5%
Indians (Asian)
89.5
/100
|
#142
Excellent
65.5%
Latvians
89.4
/100
|
#143
Excellent
65.5%
Immigrants | Romania
88.6
/100
|
#144
Excellent
65.5%
Tlingit-Haida
88.3
/100
|
#145
Excellent
65.5%
Cypriots
88.2
/100
|
#146
Excellent
65.5%
Immigrants | Oceania
87.5
/100
|
#147
Excellent
65.5%
Bhutanese
86.3
/100
|
#148
Excellent
65.5%
Immigrants | Albania
85.7
/100
|
#149
Excellent
65.4%
Immigrants | Immigrants
81.9
/100
|
#150
Excellent
65.4%
Czechs
81.5
/100
|
#151
Excellent
65.4%
Yugoslavians
81.3
/100
|
#152
Excellent
65.4%

Demographics Similar to Immigrants from England by In Labor Force | Age > 16

In terms of in labor force | age > 16, the demographic groups most similar to Immigrants from England are Cuban (64.2%, a difference of 0.010%), Canadian (64.1%, a difference of 0.010%), Spaniard (64.1%, a difference of 0.010%), Dutch (64.2%, a difference of 0.050%), and Irish (64.1%, a difference of 0.050%).
DemographicsRating | RankIn Labor Force | Age > 16
Immigrants | Western Europe
0.7
/100
|
#259
Tragic
64.2%
Marshallese
0.7
/100
|
#260
Tragic
64.2%
Basques
0.7
/100
|
#261
Tragic
64.2%
Finns
0.7
/100
|
#262
Tragic
64.2%
Bahamians
0.6
/100
|
#263
Tragic
64.2%
Dutch
0.6
/100
|
#264
Tragic
64.2%
Cubans
0.5
/100
|
#265
Tragic
64.2%
Immigrants | England
0.5
/100
|
#266
Tragic
64.2%
Canadians
0.5
/100
|
#267
Tragic
64.1%
Spaniards
0.5
/100
|
#268
Tragic
64.1%
Irish
0.4
/100
|
#269
Tragic
64.1%
Guyanese
0.4
/100
|
#270
Tragic
64.1%
Dominicans
0.4
/100
|
#271
Tragic
64.1%
Native Hawaiians
0.3
/100
|
#272
Tragic
64.1%
Hmong
0.3
/100
|
#273
Tragic
64.1%