Shoshone vs Immigrants from Burma/Myanmar In Labor Force | Age 20-64

COMPARE

Shoshone
Race
Ancestry
AfghanAfricanAlaska NativeAlaskan AthabascanAlbanianAleutAlsatianAmericanApacheArabArapahoArgentineanArmenianAssyrian/Chaldean/SyriacAustralianAustrianBahamianBangladeshiBarbadianBasqueBelgianBelizeanBermudanBhutaneseBlackfeetBolivianBrazilianBritishBritish West IndianBulgarianBurmeseCajunCambodianCanadianCape VerdeanCarpatho RusynCelticCentral AmericanCentral American IndianCherokeeCheyenneChickasawChileanChineseChippewaChoctawColombianColvilleComancheCosta RicanCreeCreekCroatianCrowCubanCypriotCzechCzechoslovakianDanishDelawareDominicanDutchDutch West IndianEastern EuropeanEcuadorianEgyptianEnglishEstonianEthiopianEuropeanFijianFilipinoFinnishFrenchFrench American IndianFrench CanadianGermanGerman RussianGhanaianGreekGuamanian/ChamorroGuatemalanGuyaneseHaitianHmongHonduranHopiHoumaHungarianIcelanderIndian (Asian)IndonesianInupiatIranianIraqiIrishIroquoisIsraeliItalianJamaicanJapaneseJordanianKenyanKiowaKoreanLaotianLatvianLebaneseLiberianLithuanianLumbeeLuxembourgerMacedonianMalaysianMalteseMarshalleseMenomineeMexicanMexican American IndianMongolianMoroccanNative HawaiianNavajoNepaleseNew ZealanderNicaraguanNigerianNorthern EuropeanNorwegianOkinawanOsageOttawaPaiutePakistaniPalestinianPanamanianParaguayanPennsylvania GermanPeruvianPimaPolishPortuguesePotawatomiPuebloPuerto RicanPuget Sound SalishRomanianRussianSalvadoranSamoanScandinavianScotch-IrishScottishSeminoleSenegaleseSerbianShoshoneSierra LeoneanSiouxSlavicSlovakSloveneSomaliSouth AfricanSouth AmericanSouth American IndianSoviet UnionSpaniardSpanishSpanish AmericanSpanish American IndianSri LankanSubsaharan AfricanSudaneseSwedishSwissSyrianTaiwaneseThaiTlingit-HaidaTohono O'OdhamTonganTrinidadian and TobagonianTsimshianTurkishU.S. Virgin IslanderUgandanUkrainianUruguayanUteVenezuelanVietnameseWelshWest IndianYakamaYaquiYugoslavianYumanYup'ikZimbabwean
Immigration
NonimmigrantsImmigrantsAfghanistanAfricaAlbaniaArgentinaArmeniaAsiaAustraliaAustriaBahamasBangladeshBarbadosBelarusBelgiumBelizeBoliviaBosnia and HerzegovinaBrazilBulgariaCabo VerdeCambodiaCameroonCanadaCaribbeanCentral AmericaChileChinaColombiaCongoCosta RicaCroatiaCubaCzechoslovakiaDenmarkDominicaDominican RepublicEastern AfricaEastern AsiaEastern EuropeEcuadorEgyptEl SalvadorEnglandEritreaEthiopiaEuropeFijiFranceGermanyGhanaGreeceGrenadaGuatemalaGuyanaHaitiHondurasHong KongHungaryIndiaIndonesiaIranIraqIrelandIsraelItalyJamaicaJapanJordanKazakhstanKenyaKoreaKuwaitLaosLatin AmericaLatviaLebanonLiberiaLithuaniaMalaysiaMexicoMicronesiaMiddle AfricaMoldovaMoroccoNepalNetherlandsNicaraguaNigeriaNorth AmericaNorth MacedoniaNorthern AfricaNorthern EuropeNorwayOceaniaPakistanPanamaPeruPhilippinesPolandPortugalRomaniaRussiaSaudi ArabiaScotlandSenegalSerbiaSierra LeoneSingaporeSomaliaSouth AfricaSouth AmericaSouth Central AsiaSouth Eastern AsiaSouthern EuropeSpainSri LankaSt. Vincent and the GrenadinesSudanSwedenSwitzerlandSyriaTaiwanThailandTrinidad and TobagoTurkeyUgandaUkraineUruguayUzbekistanVenezuelaVietnamWest IndiesWestern AfricaWestern AsiaWestern EuropeYemenZaireZimbabweAzores
Immigrants from Burma/Myanmar
Race
Ancestry
AfghanAfricanAlaska NativeAlaskan AthabascanAlbanianAleutAlsatianAmericanApacheArabArapahoArgentineanArmenianAssyrian/Chaldean/SyriacAustralianAustrianBahamianBangladeshiBarbadianBasqueBelgianBelizeanBermudanBhutaneseBlackfeetBolivianBrazilianBritishBritish West IndianBulgarianBurmeseCajunCambodianCanadianCape VerdeanCarpatho RusynCelticCentral AmericanCentral American IndianCherokeeCheyenneChickasawChileanChineseChippewaChoctawColombianColvilleComancheCosta RicanCreeCreekCroatianCrowCubanCypriotCzechCzechoslovakianDanishDelawareDominicanDutchDutch West IndianEastern EuropeanEcuadorianEgyptianEnglishEstonianEthiopianEuropeanFijianFilipinoFinnishFrenchFrench American IndianFrench CanadianGermanGerman RussianGhanaianGreekGuamanian/ChamorroGuatemalanGuyaneseHaitianHmongHonduranHopiHoumaHungarianIcelanderIndian (Asian)IndonesianInupiatIranianIraqiIrishIroquoisIsraeliItalianJamaicanJapaneseJordanianKenyanKiowaKoreanLaotianLatvianLebaneseLiberianLithuanianLumbeeLuxembourgerMacedonianMalaysianMalteseMarshalleseMenomineeMexicanMexican American IndianMongolianMoroccanNative HawaiianNavajoNepaleseNew ZealanderNicaraguanNigerianNorthern EuropeanNorwegianOkinawanOsageOttawaPaiutePakistaniPalestinianPanamanianParaguayanPennsylvania GermanPeruvianPimaPolishPortuguesePotawatomiPuebloPuerto RicanPuget Sound SalishRomanianRussianSalvadoranSamoanScandinavianScotch-IrishScottishSeminoleSenegaleseSerbianSierra LeoneanSiouxSlavicSlovakSloveneSomaliSouth AfricanSouth AmericanSouth American IndianSoviet UnionSpaniardSpanishSpanish AmericanSpanish American IndianSri LankanSubsaharan AfricanSudaneseSwedishSwissSyrianTaiwaneseThaiTlingit-HaidaTohono O'OdhamTonganTrinidadian and TobagonianTsimshianTurkishU.S. Virgin IslanderUgandanUkrainianUruguayanUteVenezuelanVietnameseWelshWest IndianYakamaYaquiYugoslavianYumanYup'ikZimbabwean
Immigration
NonimmigrantsImmigrantsAfghanistanAfricaAlbaniaArgentinaArmeniaAsiaAustraliaAustriaBahamasBangladeshBarbadosBelarusBelgiumBelizeBoliviaBosnia and HerzegovinaBrazilBulgariaBurma/MyanmarCabo VerdeCambodiaCameroonCanadaCaribbeanCentral AmericaChileChinaColombiaCongoCosta RicaCroatiaCubaCzechoslovakiaDenmarkDominicaDominican RepublicEastern AfricaEastern AsiaEastern EuropeEcuadorEgyptEl SalvadorEnglandEritreaEthiopiaEuropeFijiFranceGermanyGhanaGreeceGrenadaGuatemalaGuyanaHaitiHondurasHong KongHungaryIndiaIndonesiaIranIraqIrelandIsraelItalyJamaicaJapanJordanKazakhstanKenyaKoreaKuwaitLaosLatin AmericaLatviaLebanonLiberiaLithuaniaMalaysiaMexicoMicronesiaMiddle AfricaMoldovaMoroccoNepalNetherlandsNicaraguaNigeriaNorth AmericaNorth MacedoniaNorthern AfricaNorthern EuropeNorwayOceaniaPakistanPanamaPeruPhilippinesPolandPortugalRomaniaRussiaSaudi ArabiaScotlandSenegalSerbiaSierra LeoneSingaporeSomaliaSouth AfricaSouth AmericaSouth Central AsiaSouth Eastern AsiaSouthern EuropeSpainSri LankaSt. Vincent and the GrenadinesSudanSwedenSwitzerlandSyriaTaiwanThailandTrinidad and TobagoTurkeyUgandaUkraineUruguayUzbekistanVenezuelaVietnamWest IndiesWestern AfricaWestern AsiaWestern EuropeYemenZaireZimbabweAzores
In Labor Force | Age 20-64
Income
Poverty
Unemployment
Labor Participation
Family Structure
Vehicle Availability
Education Level
Disability

In Labor Force | Age 20-64 Comparison

Shoshone

Immigrants from Burma/Myanmar

Tragic
Good
76.8%
IN LABOR FORCE | AGE 20-64
0.0/ 100
METRIC RATING
313th/ 347
METRIC RANK
79.7%
IN LABOR FORCE | AGE 20-64
64.4/ 100
METRIC RATING
164th/ 347
METRIC RANK

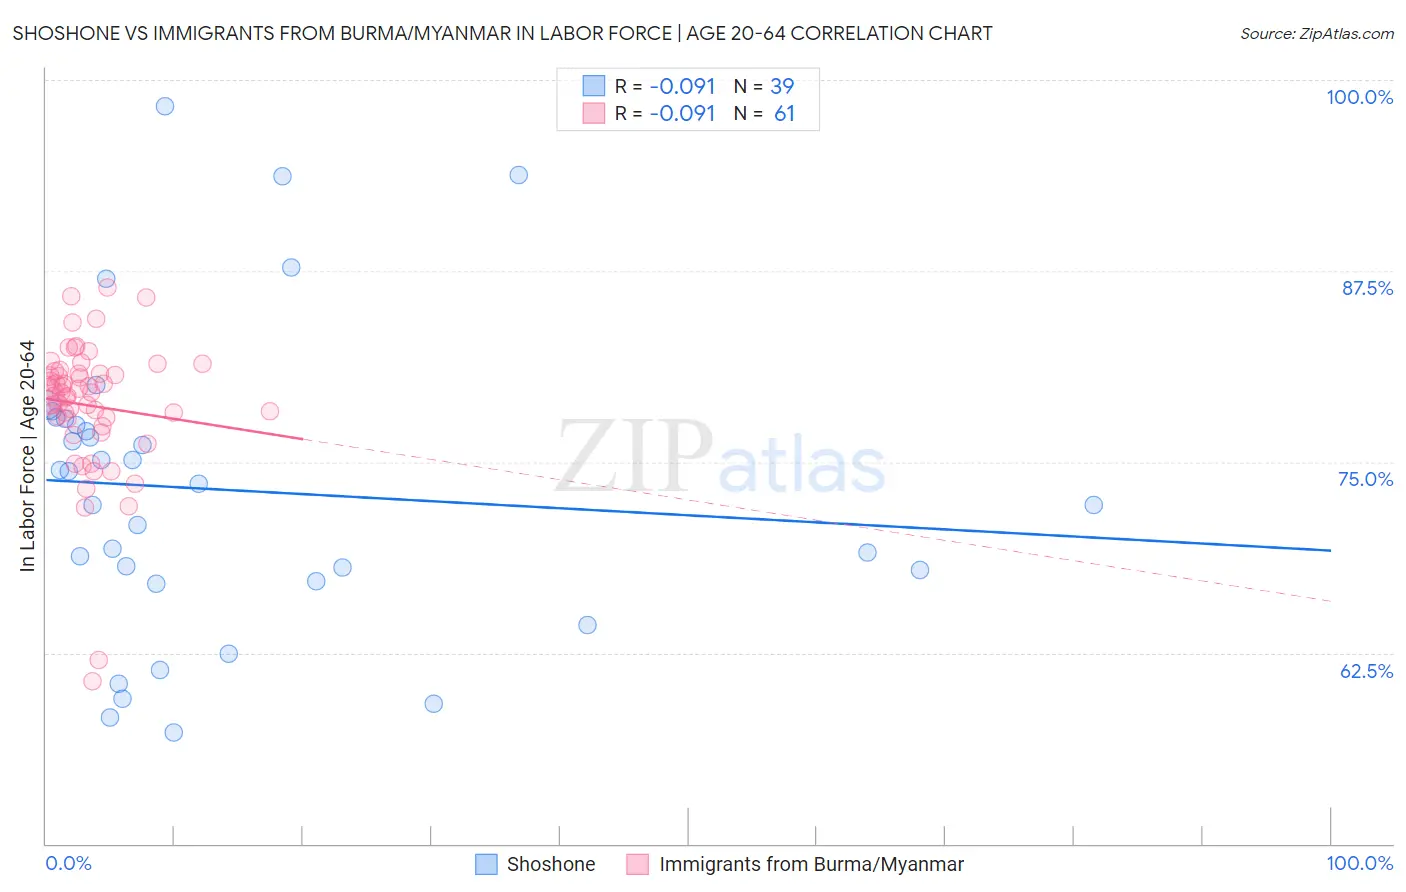
Shoshone vs Immigrants from Burma/Myanmar In Labor Force | Age 20-64 Correlation Chart

The statistical analysis conducted on geographies consisting of 66,627,303 people shows a slight negative correlation between the proportion of Shoshone and labor force participation rate among population between the ages 20 and 64 in the United States with a correlation coefficient (R) of -0.091 and weighted average of 76.8%. Similarly, the statistical analysis conducted on geographies consisting of 172,360,396 people shows a slight negative correlation between the proportion of Immigrants from Burma/Myanmar and labor force participation rate among population between the ages 20 and 64 in the United States with a correlation coefficient (R) of -0.091 and weighted average of 79.7%, a difference of 3.7%.
Shoshone vs Immigrants from Burma/Myanmar In Labor Force | Age 20-64

In Labor Force | Age 20-64 Correlation Summary

MeasurementShoshoneImmigrants from Burma/Myanmar
Minimum57.3%60.6%
Maximum98.3%86.4%
Range41.0%25.8%
Mean73.2%78.7%
Median73.6%79.5%
Interquartile 25% (IQ1)67.2%77.6%
Interquartile 75% (IQ3)77.8%80.9%
Interquartile Range (IQR)10.6%3.3%
Standard Deviation (Sample)9.8%4.5%
Standard Deviation (Population)9.7%4.5%

Similar Demographics by In Labor Force | Age 20-64

Demographics Similar to Shoshone by In Labor Force | Age 20-64

In terms of in labor force | age 20-64, the demographic groups most similar to Shoshone are Black/African American (76.8%, a difference of 0.020%), Alaskan Athabascan (76.9%, a difference of 0.12%), Ottawa (76.7%, a difference of 0.12%), Blackfeet (77.0%, a difference of 0.29%), and Yaqui (76.5%, a difference of 0.31%).
DemographicsRating | RankIn Labor Force | Age 20-64
Potawatomi
0.0
/100
|
#306
Tragic
77.2%
Central American Indians
0.0
/100
|
#307
Tragic
77.1%
Alaska Natives
0.0
/100
|
#308
Tragic
77.0%
Americans
0.0
/100
|
#309
Tragic
77.0%
Comanche
0.0
/100
|
#310
Tragic
77.0%
Blackfeet
0.0
/100
|
#311
Tragic
77.0%
Alaskan Athabascans
0.0
/100
|
#312
Tragic
76.9%
Shoshone
0.0
/100
|
#313
Tragic
76.8%
Blacks/African Americans
0.0
/100
|
#314
Tragic
76.8%
Ottawa
0.0
/100
|
#315
Tragic
76.7%
Yaqui
0.0
/100
|
#316
Tragic
76.5%
Cherokee
0.0
/100
|
#317
Tragic
76.2%
Chickasaw
0.0
/100
|
#318
Tragic
76.2%
Inupiat
0.0
/100
|
#319
Tragic
76.1%
Yakama
0.0
/100
|
#320
Tragic
75.8%

Demographics Similar to Immigrants from Burma/Myanmar by In Labor Force | Age 20-64

In terms of in labor force | age 20-64, the demographic groups most similar to Immigrants from Burma/Myanmar are Immigrants from Costa Rica (79.7%, a difference of 0.0%), Nigerian (79.7%, a difference of 0.0%), German (79.7%, a difference of 0.010%), Okinawan (79.6%, a difference of 0.010%), and Immigrants from Cuba (79.7%, a difference of 0.020%).
DemographicsRating | RankIn Labor Force | Age 20-64
Immigrants | China
69.1
/100
|
#157
Good
79.7%
Austrians
67.6
/100
|
#158
Good
79.7%
Immigrants | Cuba
66.7
/100
|
#159
Good
79.7%
Moroccans
66.7
/100
|
#160
Good
79.7%
South Africans
66.2
/100
|
#161
Good
79.7%
Germans
65.2
/100
|
#162
Good
79.7%
Immigrants | Costa Rica
64.6
/100
|
#163
Good
79.7%
Immigrants | Burma/Myanmar
64.4
/100
|
#164
Good
79.7%
Nigerians
64.0
/100
|
#165
Good
79.7%
Okinawans
62.7
/100
|
#166
Good
79.6%
Immigrants | Iraq
62.0
/100
|
#167
Good
79.6%
Immigrants | Indonesia
61.8
/100
|
#168
Good
79.6%
Laotians
58.4
/100
|
#169
Average
79.6%
Slavs
54.0
/100
|
#170
Average
79.6%
Immigrants | Switzerland
53.3
/100
|
#171
Average
79.6%