Paraguayan vs Cypriot In Labor Force | Age > 16

COMPARE

Paraguayan
Race
Ancestry
AfghanAfricanAlaska NativeAlaskan AthabascanAlbanianAleutAlsatianAmericanApacheArabArapahoArgentineanArmenianAssyrian/Chaldean/SyriacAustralianAustrianBahamianBangladeshiBarbadianBasqueBelgianBelizeanBermudanBhutaneseBlackfeetBolivianBrazilianBritishBritish West IndianBulgarianBurmeseCajunCambodianCanadianCape VerdeanCarpatho RusynCelticCentral AmericanCentral American IndianCherokeeCheyenneChickasawChileanChineseChippewaChoctawColombianColvilleComancheCosta RicanCreeCreekCroatianCrowCubanCzechCzechoslovakianDanishDelawareDominicanDutchDutch West IndianEastern EuropeanEcuadorianEgyptianEnglishEstonianEthiopianEuropeanFijianFilipinoFinnishFrenchFrench American IndianFrench CanadianGermanGerman RussianGhanaianGreekGuamanian/ChamorroGuatemalanGuyaneseHaitianHmongHonduranHopiHoumaHungarianIcelanderIndian (Asian)IndonesianInupiatIranianIraqiIrishIroquoisIsraeliItalianJamaicanJapaneseJordanianKenyanKiowaKoreanLaotianLatvianLebaneseLiberianLithuanianLumbeeLuxembourgerMacedonianMalaysianMalteseMarshalleseMenomineeMexicanMexican American IndianMongolianMoroccanNative HawaiianNavajoNepaleseNew ZealanderNicaraguanNigerianNorthern EuropeanNorwegianOkinawanOsageOttawaPaiutePakistaniPalestinianPanamanianParaguayanPennsylvania GermanPeruvianPimaPolishPortuguesePotawatomiPuebloPuerto RicanPuget Sound SalishRomanianRussianSalvadoranSamoanScandinavianScotch-IrishScottishSeminoleSenegaleseSerbianShoshoneSierra LeoneanSiouxSlavicSlovakSloveneSomaliSouth AfricanSouth AmericanSouth American IndianSoviet UnionSpaniardSpanishSpanish AmericanSpanish American IndianSri LankanSubsaharan AfricanSudaneseSwedishSwissSyrianTaiwaneseThaiTlingit-HaidaTohono O'OdhamTonganTrinidadian and TobagonianTsimshianTurkishU.S. Virgin IslanderUgandanUkrainianUruguayanUteVenezuelanVietnameseWelshWest IndianYakamaYaquiYugoslavianYumanYup'ikZimbabwean
Immigration
NonimmigrantsImmigrantsAfghanistanAfricaAlbaniaArgentinaArmeniaAsiaAustraliaAustriaBahamasBangladeshBarbadosBelarusBelgiumBelizeBoliviaBosnia and HerzegovinaBrazilBulgariaBurma/MyanmarCabo VerdeCambodiaCameroonCanadaCaribbeanCentral AmericaChileChinaColombiaCongoCosta RicaCroatiaCubaCzechoslovakiaDenmarkDominicaDominican RepublicEastern AfricaEastern AsiaEastern EuropeEcuadorEgyptEl SalvadorEnglandEritreaEthiopiaEuropeFijiFranceGermanyGhanaGreeceGrenadaGuatemalaGuyanaHaitiHondurasHong KongHungaryIndiaIndonesiaIranIraqIrelandIsraelItalyJamaicaJapanJordanKazakhstanKenyaKoreaKuwaitLaosLatin AmericaLatviaLebanonLiberiaLithuaniaMalaysiaMexicoMicronesiaMiddle AfricaMoldovaMoroccoNepalNetherlandsNicaraguaNigeriaNorth AmericaNorth MacedoniaNorthern AfricaNorthern EuropeNorwayOceaniaPakistanPanamaPeruPhilippinesPolandPortugalRomaniaRussiaSaudi ArabiaScotlandSenegalSerbiaSierra LeoneSingaporeSomaliaSouth AfricaSouth AmericaSouth Central AsiaSouth Eastern AsiaSouthern EuropeSpainSri LankaSt. Vincent and the GrenadinesSudanSwedenSwitzerlandSyriaTaiwanThailandTrinidad and TobagoTurkeyUgandaUkraineUruguayUzbekistanVenezuelaVietnamWest IndiesWestern AfricaWestern AsiaWestern EuropeYemenZaireZimbabweAzores
Cypriot
Race
Ancestry
AfghanAfricanAlaska NativeAlaskan AthabascanAlbanianAleutAlsatianAmericanApacheArabArapahoArgentineanArmenianAssyrian/Chaldean/SyriacAustralianAustrianBahamianBangladeshiBarbadianBasqueBelgianBelizeanBermudanBhutaneseBlackfeetBolivianBrazilianBritishBritish West IndianBulgarianBurmeseCajunCambodianCanadianCape VerdeanCarpatho RusynCelticCentral AmericanCentral American IndianCherokeeCheyenneChickasawChileanChineseChippewaChoctawColombianColvilleComancheCosta RicanCreeCreekCroatianCrowCubanCypriotCzechCzechoslovakianDanishDelawareDominicanDutchDutch West IndianEastern EuropeanEcuadorianEgyptianEnglishEstonianEthiopianEuropeanFijianFilipinoFinnishFrenchFrench American IndianFrench CanadianGermanGerman RussianGhanaianGreekGuamanian/ChamorroGuatemalanGuyaneseHaitianHmongHonduranHopiHoumaHungarianIcelanderIndian (Asian)IndonesianInupiatIranianIraqiIrishIroquoisIsraeliItalianJamaicanJapaneseJordanianKenyanKiowaKoreanLaotianLatvianLebaneseLiberianLithuanianLumbeeLuxembourgerMacedonianMalaysianMalteseMarshalleseMenomineeMexicanMexican American IndianMongolianMoroccanNative HawaiianNavajoNepaleseNew ZealanderNicaraguanNigerianNorthern EuropeanNorwegianOkinawanOsageOttawaPaiutePakistaniPalestinianPanamanianPennsylvania GermanPeruvianPimaPolishPortuguesePotawatomiPuebloPuerto RicanPuget Sound SalishRomanianRussianSalvadoranSamoanScandinavianScotch-IrishScottishSeminoleSenegaleseSerbianShoshoneSierra LeoneanSiouxSlavicSlovakSloveneSomaliSouth AfricanSouth AmericanSouth American IndianSoviet UnionSpaniardSpanishSpanish AmericanSpanish American IndianSri LankanSubsaharan AfricanSudaneseSwedishSwissSyrianTaiwaneseThaiTlingit-HaidaTohono O'OdhamTonganTrinidadian and TobagonianTsimshianTurkishU.S. Virgin IslanderUgandanUkrainianUruguayanUteVenezuelanVietnameseWelshWest IndianYakamaYaquiYugoslavianYumanYup'ikZimbabwean
Immigration
NonimmigrantsImmigrantsAfghanistanAfricaAlbaniaArgentinaArmeniaAsiaAustraliaAustriaBahamasBangladeshBarbadosBelarusBelgiumBelizeBoliviaBosnia and HerzegovinaBrazilBulgariaBurma/MyanmarCabo VerdeCambodiaCameroonCanadaCaribbeanCentral AmericaChileChinaColombiaCongoCosta RicaCroatiaCubaCzechoslovakiaDenmarkDominicaDominican RepublicEastern AfricaEastern AsiaEastern EuropeEcuadorEgyptEl SalvadorEnglandEritreaEthiopiaEuropeFijiFranceGermanyGhanaGreeceGrenadaGuatemalaGuyanaHaitiHondurasHong KongHungaryIndiaIndonesiaIranIraqIrelandIsraelItalyJamaicaJapanJordanKazakhstanKenyaKoreaKuwaitLaosLatin AmericaLatviaLebanonLiberiaLithuaniaMalaysiaMexicoMicronesiaMiddle AfricaMoldovaMoroccoNepalNetherlandsNicaraguaNigeriaNorth AmericaNorth MacedoniaNorthern AfricaNorthern EuropeNorwayOceaniaPakistanPanamaPeruPhilippinesPolandPortugalRomaniaRussiaSaudi ArabiaScotlandSenegalSerbiaSierra LeoneSingaporeSomaliaSouth AfricaSouth AmericaSouth Central AsiaSouth Eastern AsiaSouthern EuropeSpainSri LankaSt. Vincent and the GrenadinesSudanSwedenSwitzerlandSyriaTaiwanThailandTrinidad and TobagoTurkeyUgandaUkraineUruguayUzbekistanVenezuelaVietnamWest IndiesWestern AfricaWestern AsiaWestern EuropeYemenZaireZimbabweAzores
In Labor Force | Age > 16
Income
Poverty
Unemployment
Labor Participation
Family Structure
Vehicle Availability
Education Level
Disability

In Labor Force | Age > 16 Comparison

Paraguayans

Cypriots

Exceptional
Excellent
66.5%
IN LABOR FORCE | AGE > 16
99.9/ 100
METRIC RATING
52nd/ 347
METRIC RANK
65.5%
IN LABOR FORCE | AGE > 16
88.2/ 100
METRIC RATING
146th/ 347
METRIC RANK

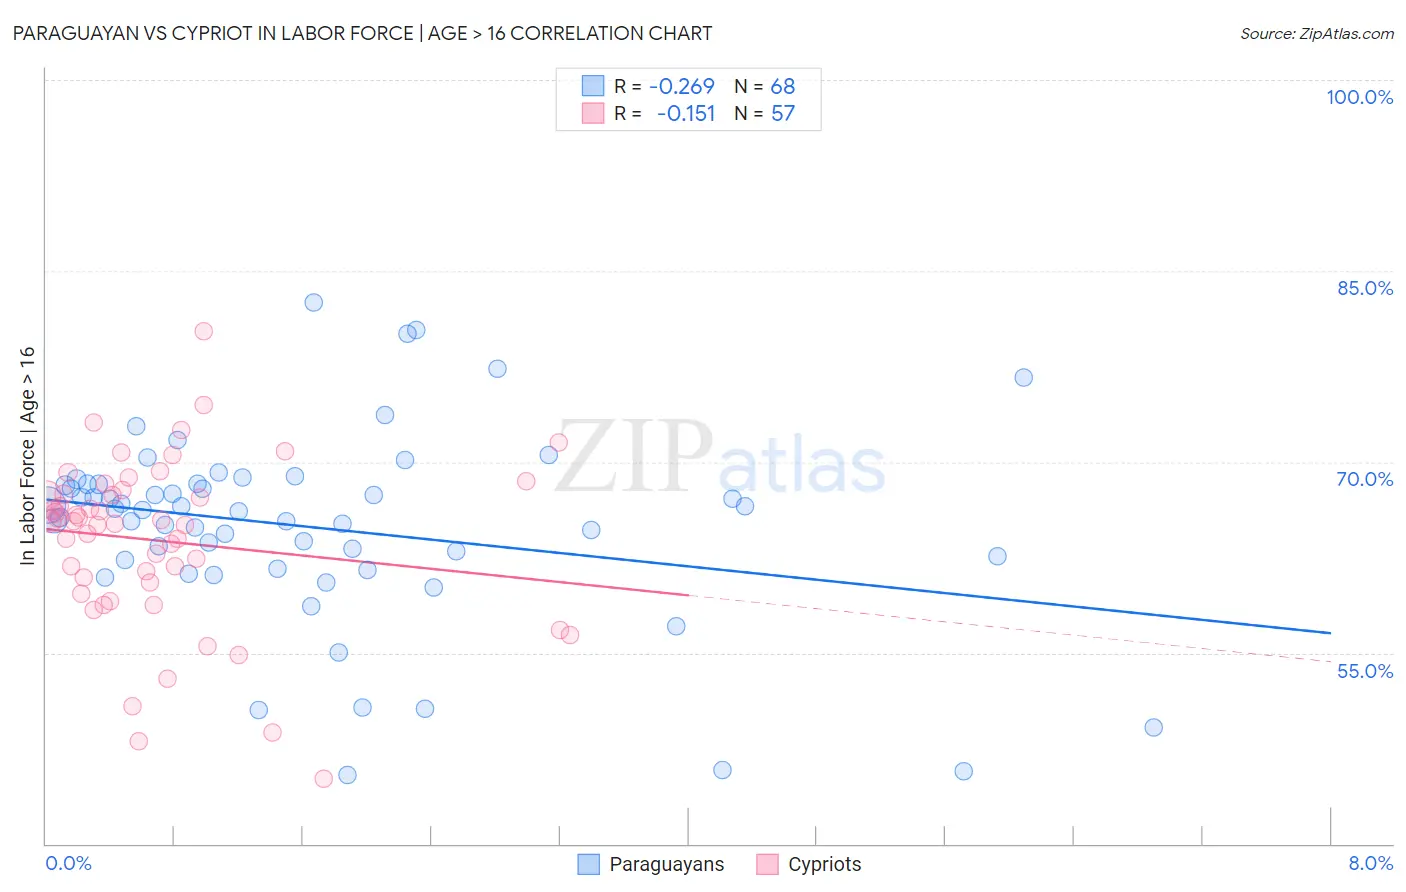
Paraguayan vs Cypriot In Labor Force | Age > 16 Correlation Chart

The statistical analysis conducted on geographies consisting of 95,115,093 people shows a weak negative correlation between the proportion of Paraguayans and labor force participation rate among population ages 16 and over in the United States with a correlation coefficient (R) of -0.269 and weighted average of 66.5%. Similarly, the statistical analysis conducted on geographies consisting of 61,870,589 people shows a poor negative correlation between the proportion of Cypriots and labor force participation rate among population ages 16 and over in the United States with a correlation coefficient (R) of -0.151 and weighted average of 65.5%, a difference of 1.5%.
Paraguayan vs Cypriot In Labor Force | Age > 16

In Labor Force | Age > 16 Correlation Summary

MeasurementParaguayanCypriot
Minimum45.4%45.1%
Maximum82.5%80.3%
Range37.1%35.2%
Mean64.8%63.8%
Median66.1%65.3%
Interquartile 25% (IQ1)61.9%60.1%
Interquartile 75% (IQ3)68.2%67.6%
Interquartile Range (IQR)6.3%7.6%
Standard Deviation (Sample)7.6%6.7%
Standard Deviation (Population)7.5%6.6%

Similar Demographics by In Labor Force | Age > 16

Demographics Similar to Paraguayans by In Labor Force | Age > 16

In terms of in labor force | age > 16, the demographic groups most similar to Paraguayans are Immigrants from Sri Lanka (66.5%, a difference of 0.020%), Immigrants from Kuwait (66.5%, a difference of 0.030%), Immigrants from Bosnia and Herzegovina (66.5%, a difference of 0.050%), Cape Verdean (66.6%, a difference of 0.10%), and Immigrants from Venezuela (66.4%, a difference of 0.10%).
DemographicsRating | RankIn Labor Force | Age > 16
Immigrants | Brazil
100.0
/100
|
#45
Exceptional
66.7%
Brazilians
100.0
/100
|
#46
Exceptional
66.6%
Immigrants | Bulgaria
100.0
/100
|
#47
Exceptional
66.6%
Nigerians
100.0
/100
|
#48
Exceptional
66.6%
Immigrants | Northern Africa
100.0
/100
|
#49
Exceptional
66.6%
Cape Verdeans
100.0
/100
|
#50
Exceptional
66.6%
Immigrants | Kuwait
100.0
/100
|
#51
Exceptional
66.5%
Paraguayans
99.9
/100
|
#52
Exceptional
66.5%
Immigrants | Sri Lanka
99.9
/100
|
#53
Exceptional
66.5%
Immigrants | Bosnia and Herzegovina
99.9
/100
|
#54
Exceptional
66.5%
Immigrants | Venezuela
99.9
/100
|
#55
Exceptional
66.4%
Immigrants | Senegal
99.9
/100
|
#56
Exceptional
66.4%
Bulgarians
99.9
/100
|
#57
Exceptional
66.4%
Immigrants | Saudi Arabia
99.9
/100
|
#58
Exceptional
66.3%
Immigrants | Turkey
99.9
/100
|
#59
Exceptional
66.3%

Demographics Similar to Cypriots by In Labor Force | Age > 16

In terms of in labor force | age > 16, the demographic groups most similar to Cypriots are Tlingit-Haida (65.5%, a difference of 0.0%), Immigrants from Romania (65.5%, a difference of 0.010%), Immigrants from Oceania (65.5%, a difference of 0.020%), Indian (Asian) (65.5%, a difference of 0.040%), and Latvian (65.5%, a difference of 0.040%).
DemographicsRating | RankIn Labor Force | Age > 16
Immigrants | Taiwan
90.8
/100
|
#139
Exceptional
65.5%
Immigrants | Costa Rica
90.8
/100
|
#140
Exceptional
65.5%
Samoans
90.5
/100
|
#141
Exceptional
65.5%
Indians (Asian)
89.5
/100
|
#142
Excellent
65.5%
Latvians
89.4
/100
|
#143
Excellent
65.5%
Immigrants | Romania
88.6
/100
|
#144
Excellent
65.5%
Tlingit-Haida
88.3
/100
|
#145
Excellent
65.5%
Cypriots
88.2
/100
|
#146
Excellent
65.5%
Immigrants | Oceania
87.5
/100
|
#147
Excellent
65.5%
Bhutanese
86.3
/100
|
#148
Excellent
65.5%
Immigrants | Albania
85.7
/100
|
#149
Excellent
65.4%
Immigrants | Immigrants
81.9
/100
|
#150
Excellent
65.4%
Czechs
81.5
/100
|
#151
Excellent
65.4%
Yugoslavians
81.3
/100
|
#152
Excellent
65.4%
Immigrants | China
80.5
/100
|
#153
Excellent
65.4%