Immigrants from Brazil vs Immigrants from Western Europe In Labor Force | Age 20-64

COMPARE

Immigrants from Brazil
Race
Ancestry
AfghanAfricanAlaska NativeAlaskan AthabascanAlbanianAleutAlsatianAmericanApacheArabArapahoArgentineanArmenianAssyrian/Chaldean/SyriacAustralianAustrianBahamianBangladeshiBarbadianBasqueBelgianBelizeanBermudanBhutaneseBlackfeetBolivianBrazilianBritishBritish West IndianBulgarianBurmeseCajunCambodianCanadianCape VerdeanCarpatho RusynCelticCentral AmericanCentral American IndianCherokeeCheyenneChickasawChileanChineseChippewaChoctawColombianColvilleComancheCosta RicanCreeCreekCroatianCrowCubanCypriotCzechCzechoslovakianDanishDelawareDominicanDutchDutch West IndianEastern EuropeanEcuadorianEgyptianEnglishEstonianEthiopianEuropeanFijianFilipinoFinnishFrenchFrench American IndianFrench CanadianGermanGerman RussianGhanaianGreekGuamanian/ChamorroGuatemalanGuyaneseHaitianHmongHonduranHopiHoumaHungarianIcelanderIndian (Asian)IndonesianInupiatIranianIraqiIrishIroquoisIsraeliItalianJamaicanJapaneseJordanianKenyanKiowaKoreanLaotianLatvianLebaneseLiberianLithuanianLumbeeLuxembourgerMacedonianMalaysianMalteseMarshalleseMenomineeMexicanMexican American IndianMongolianMoroccanNative HawaiianNavajoNepaleseNew ZealanderNicaraguanNigerianNorthern EuropeanNorwegianOkinawanOsageOttawaPaiutePakistaniPalestinianPanamanianParaguayanPennsylvania GermanPeruvianPimaPolishPortuguesePotawatomiPuebloPuerto RicanPuget Sound SalishRomanianRussianSalvadoranSamoanScandinavianScotch-IrishScottishSeminoleSenegaleseSerbianShoshoneSierra LeoneanSiouxSlavicSlovakSloveneSomaliSouth AfricanSouth AmericanSouth American IndianSoviet UnionSpaniardSpanishSpanish AmericanSpanish American IndianSri LankanSubsaharan AfricanSudaneseSwedishSwissSyrianTaiwaneseThaiTlingit-HaidaTohono O'OdhamTonganTrinidadian and TobagonianTsimshianTurkishU.S. Virgin IslanderUgandanUkrainianUruguayanUteVenezuelanVietnameseWelshWest IndianYakamaYaquiYugoslavianYumanYup'ikZimbabwean
Immigration
NonimmigrantsImmigrantsAfghanistanAfricaAlbaniaArgentinaArmeniaAsiaAustraliaAustriaBahamasBangladeshBarbadosBelarusBelgiumBelizeBoliviaBosnia and HerzegovinaBrazilBulgariaBurma/MyanmarCabo VerdeCambodiaCameroonCanadaCaribbeanCentral AmericaChileChinaColombiaCongoCosta RicaCroatiaCubaCzechoslovakiaDenmarkDominicaDominican RepublicEastern AfricaEastern AsiaEastern EuropeEcuadorEgyptEl SalvadorEnglandEritreaEthiopiaEuropeFijiFranceGermanyGhanaGreeceGrenadaGuatemalaGuyanaHaitiHondurasHong KongHungaryIndiaIndonesiaIranIraqIrelandIsraelItalyJamaicaJapanJordanKazakhstanKenyaKoreaKuwaitLaosLatin AmericaLatviaLebanonLiberiaLithuaniaMalaysiaMexicoMicronesiaMiddle AfricaMoldovaMoroccoNepalNetherlandsNicaraguaNigeriaNorth AmericaNorth MacedoniaNorthern AfricaNorthern EuropeNorwayOceaniaPakistanPanamaPeruPhilippinesPolandPortugalRomaniaRussiaSaudi ArabiaScotlandSenegalSerbiaSierra LeoneSingaporeSomaliaSouth AfricaSouth AmericaSouth Central AsiaSouth Eastern AsiaSouthern EuropeSpainSri LankaSt. Vincent and the GrenadinesSudanSwedenSwitzerlandSyriaTaiwanThailandTrinidad and TobagoTurkeyUgandaUkraineUruguayUzbekistanVenezuelaVietnamWest IndiesWestern AfricaWestern AsiaYemenZaireZimbabweAzores
Immigrants from Western Europe
Race
Ancestry
AfghanAfricanAlaska NativeAlaskan AthabascanAlbanianAleutAlsatianAmericanApacheArabArapahoArgentineanArmenianAssyrian/Chaldean/SyriacAustralianAustrianBahamianBangladeshiBarbadianBasqueBelgianBelizeanBermudanBhutaneseBlackfeetBolivianBrazilianBritishBritish West IndianBulgarianBurmeseCajunCambodianCanadianCape VerdeanCarpatho RusynCelticCentral AmericanCentral American IndianCherokeeCheyenneChickasawChileanChineseChippewaChoctawColombianColvilleComancheCosta RicanCreeCreekCroatianCrowCubanCypriotCzechCzechoslovakianDanishDelawareDominicanDutchDutch West IndianEastern EuropeanEcuadorianEgyptianEnglishEstonianEthiopianEuropeanFijianFilipinoFinnishFrenchFrench American IndianFrench CanadianGermanGerman RussianGhanaianGreekGuamanian/ChamorroGuatemalanGuyaneseHaitianHmongHonduranHopiHoumaHungarianIcelanderIndian (Asian)IndonesianInupiatIranianIraqiIrishIroquoisIsraeliItalianJamaicanJapaneseJordanianKenyanKiowaKoreanLaotianLatvianLebaneseLiberianLithuanianLumbeeLuxembourgerMacedonianMalaysianMalteseMarshalleseMenomineeMexicanMexican American IndianMongolianMoroccanNative HawaiianNavajoNepaleseNew ZealanderNicaraguanNigerianNorthern EuropeanNorwegianOkinawanOsageOttawaPaiutePakistaniPalestinianPanamanianParaguayanPennsylvania GermanPeruvianPimaPolishPortuguesePotawatomiPuebloPuerto RicanPuget Sound SalishRomanianRussianSalvadoranSamoanScandinavianScotch-IrishScottishSeminoleSenegaleseSerbianShoshoneSierra LeoneanSiouxSlavicSlovakSloveneSomaliSouth AfricanSouth AmericanSouth American IndianSoviet UnionSpaniardSpanishSpanish AmericanSpanish American IndianSri LankanSubsaharan AfricanSudaneseSwedishSwissSyrianTaiwaneseThaiTlingit-HaidaTohono O'OdhamTonganTrinidadian and TobagonianTsimshianTurkishU.S. Virgin IslanderUgandanUkrainianUruguayanUteVenezuelanVietnameseWelshWest IndianYakamaYaquiYugoslavianYumanYup'ikZimbabwean
Immigration
NonimmigrantsImmigrantsAfghanistanAfricaAlbaniaArgentinaArmeniaAsiaAustraliaAustriaBahamasBangladeshBarbadosBelarusBelgiumBelizeBoliviaBosnia and HerzegovinaBulgariaBurma/MyanmarCabo VerdeCambodiaCameroonCanadaCaribbeanCentral AmericaChileChinaColombiaCongoCosta RicaCroatiaCubaCzechoslovakiaDenmarkDominicaDominican RepublicEastern AfricaEastern AsiaEastern EuropeEcuadorEgyptEl SalvadorEnglandEritreaEthiopiaEuropeFijiFranceGermanyGhanaGreeceGrenadaGuatemalaGuyanaHaitiHondurasHong KongHungaryIndiaIndonesiaIranIraqIrelandIsraelItalyJamaicaJapanJordanKazakhstanKenyaKoreaKuwaitLaosLatin AmericaLatviaLebanonLiberiaLithuaniaMalaysiaMexicoMicronesiaMiddle AfricaMoldovaMoroccoNepalNetherlandsNicaraguaNigeriaNorth AmericaNorth MacedoniaNorthern AfricaNorthern EuropeNorwayOceaniaPakistanPanamaPeruPhilippinesPolandPortugalRomaniaRussiaSaudi ArabiaScotlandSenegalSerbiaSierra LeoneSingaporeSomaliaSouth AfricaSouth AmericaSouth Central AsiaSouth Eastern AsiaSouthern EuropeSpainSri LankaSt. Vincent and the GrenadinesSudanSwedenSwitzerlandSyriaTaiwanThailandTrinidad and TobagoTurkeyUgandaUkraineUruguayUzbekistanVenezuelaVietnamWest IndiesWestern AfricaWestern AsiaWestern EuropeYemenZaireZimbabweAzores
In Labor Force | Age 20-64
Income
Poverty
Unemployment
Labor Participation
Family Structure
Vehicle Availability
Education Level
Disability

In Labor Force | Age 20-64 Comparison

Immigrants from Brazil

Immigrants from Western Europe

Exceptional
Tragic
80.7%
IN LABOR FORCE | AGE 20-64
99.9/ 100
METRIC RATING
34th/ 347
METRIC RANK
79.1%
IN LABOR FORCE | AGE 20-64
5.9/ 100
METRIC RATING
227th/ 347
METRIC RANK

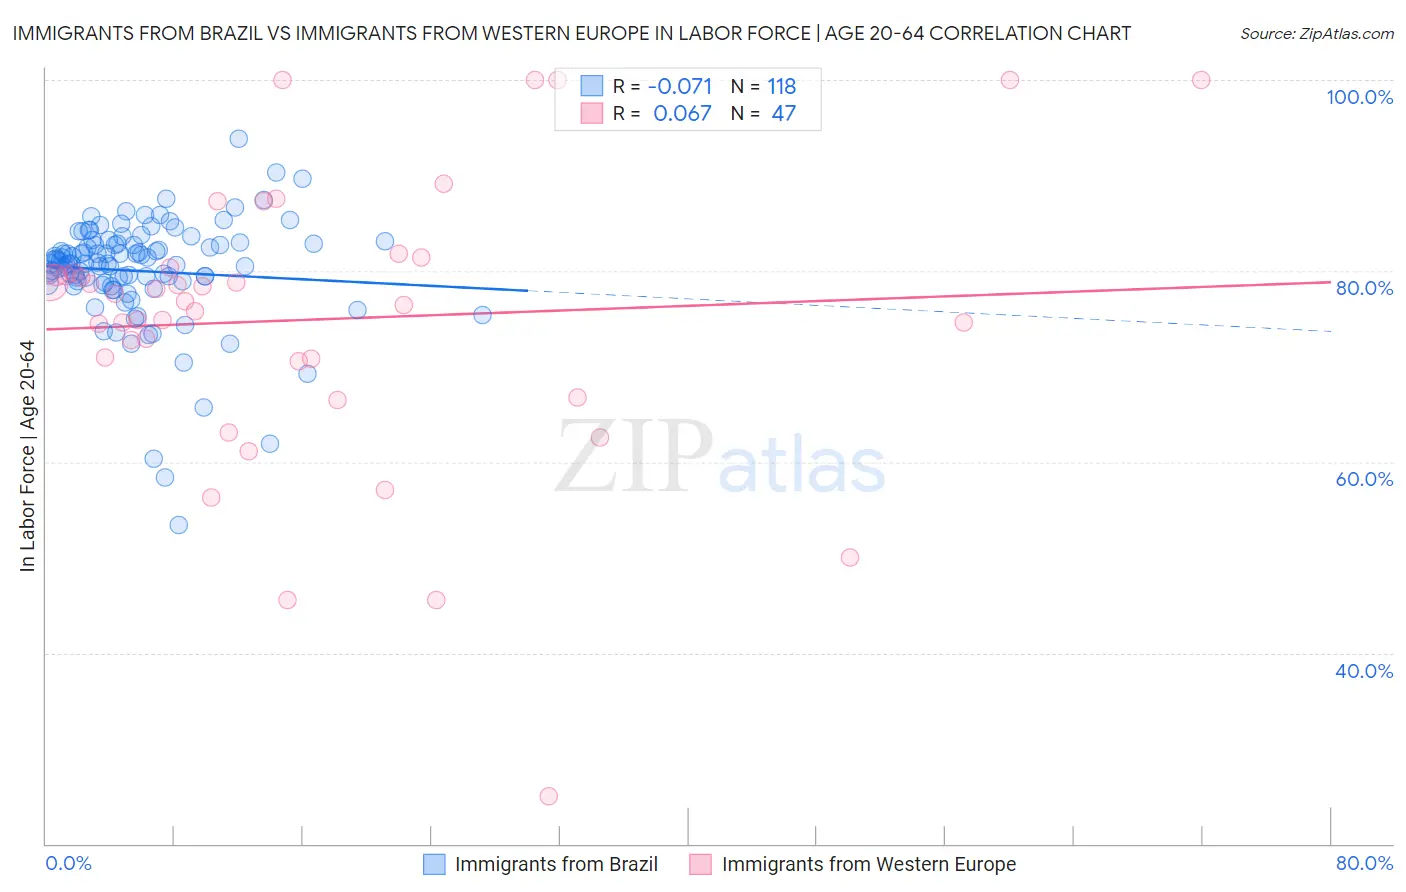
Immigrants from Brazil vs Immigrants from Western Europe In Labor Force | Age 20-64 Correlation Chart

The statistical analysis conducted on geographies consisting of 343,008,665 people shows a slight negative correlation between the proportion of Immigrants from Brazil and labor force participation rate among population between the ages 20 and 64 in the United States with a correlation coefficient (R) of -0.071 and weighted average of 80.7%. Similarly, the statistical analysis conducted on geographies consisting of 494,082,110 people shows a slight positive correlation between the proportion of Immigrants from Western Europe and labor force participation rate among population between the ages 20 and 64 in the United States with a correlation coefficient (R) of 0.067 and weighted average of 79.1%, a difference of 1.9%.
Immigrants from Brazil vs Immigrants from Western Europe In Labor Force | Age 20-64

In Labor Force | Age 20-64 Correlation Summary

MeasurementImmigrants from BrazilImmigrants from Western Europe
Minimum53.4%25.0%
Maximum93.9%100.0%
Range40.5%75.0%
Mean80.0%74.9%
Median80.8%76.8%
Interquartile 25% (IQ1)78.8%70.6%
Interquartile 75% (IQ3)82.9%80.3%
Interquartile Range (IQR)4.1%9.8%
Standard Deviation (Sample)5.8%15.0%
Standard Deviation (Population)5.8%14.8%

Similar Demographics by In Labor Force | Age 20-64

Demographics Similar to Immigrants from Brazil by In Labor Force | Age 20-64

In terms of in labor force | age 20-64, the demographic groups most similar to Immigrants from Brazil are Chinese (80.7%, a difference of 0.020%), Immigrants from Poland (80.6%, a difference of 0.030%), Immigrants from Ireland (80.7%, a difference of 0.060%), Immigrants from Lithuania (80.7%, a difference of 0.070%), and Immigrants from South Central Asia (80.7%, a difference of 0.090%).
DemographicsRating | RankIn Labor Force | Age 20-64
Immigrants | Kenya
99.9
/100
|
#27
Exceptional
80.7%
Immigrants | Uganda
99.9
/100
|
#28
Exceptional
80.7%
Immigrants | South Central Asia
99.9
/100
|
#29
Exceptional
80.7%
Immigrants | North Macedonia
99.9
/100
|
#30
Exceptional
80.7%
Immigrants | Lithuania
99.9
/100
|
#31
Exceptional
80.7%
Immigrants | Ireland
99.9
/100
|
#32
Exceptional
80.7%
Chinese
99.9
/100
|
#33
Exceptional
80.7%
Immigrants | Brazil
99.9
/100
|
#34
Exceptional
80.7%
Immigrants | Poland
99.9
/100
|
#35
Exceptional
80.6%
Paraguayans
99.8
/100
|
#36
Exceptional
80.6%
Immigrants | Moldova
99.8
/100
|
#37
Exceptional
80.6%
Ugandans
99.8
/100
|
#38
Exceptional
80.6%
Brazilians
99.8
/100
|
#39
Exceptional
80.5%
Immigrants | Zimbabwe
99.8
/100
|
#40
Exceptional
80.5%
Immigrants | Liberia
99.8
/100
|
#41
Exceptional
80.5%

Demographics Similar to Immigrants from Western Europe by In Labor Force | Age 20-64

In terms of in labor force | age 20-64, the demographic groups most similar to Immigrants from Western Europe are Central American (79.1%, a difference of 0.0%), Panamanian (79.1%, a difference of 0.010%), Alsatian (79.1%, a difference of 0.010%), Native Hawaiian (79.1%, a difference of 0.010%), and Portuguese (79.1%, a difference of 0.020%).
DemographicsRating | RankIn Labor Force | Age 20-64
Immigrants | Immigrants
7.7
/100
|
#220
Tragic
79.2%
Hungarians
7.2
/100
|
#221
Tragic
79.2%
Immigrants | Panama
6.9
/100
|
#222
Tragic
79.1%
Canadians
6.8
/100
|
#223
Tragic
79.1%
Immigrants | Uzbekistan
6.8
/100
|
#224
Tragic
79.1%
Portuguese
6.4
/100
|
#225
Tragic
79.1%
Central Americans
5.9
/100
|
#226
Tragic
79.1%
Immigrants | Western Europe
5.9
/100
|
#227
Tragic
79.1%
Panamanians
5.7
/100
|
#228
Tragic
79.1%
Alsatians
5.7
/100
|
#229
Tragic
79.1%
Native Hawaiians
5.6
/100
|
#230
Tragic
79.1%
Lebanese
5.1
/100
|
#231
Tragic
79.1%
Guamanians/Chamorros
4.5
/100
|
#232
Tragic
79.1%
Japanese
4.0
/100
|
#233
Tragic
79.1%
Immigrants | Canada
3.2
/100
|
#234
Tragic
79.0%