Immigrants from Brazil vs Sierra Leonean In Labor Force | Age 20-64

COMPARE

Immigrants from Brazil
Race
Ancestry
AfghanAfricanAlaska NativeAlaskan AthabascanAlbanianAleutAlsatianAmericanApacheArabArapahoArgentineanArmenianAssyrian/Chaldean/SyriacAustralianAustrianBahamianBangladeshiBarbadianBasqueBelgianBelizeanBermudanBhutaneseBlackfeetBolivianBrazilianBritishBritish West IndianBulgarianBurmeseCajunCambodianCanadianCape VerdeanCarpatho RusynCelticCentral AmericanCentral American IndianCherokeeCheyenneChickasawChileanChineseChippewaChoctawColombianColvilleComancheCosta RicanCreeCreekCroatianCrowCubanCypriotCzechCzechoslovakianDanishDelawareDominicanDutchDutch West IndianEastern EuropeanEcuadorianEgyptianEnglishEstonianEthiopianEuropeanFijianFilipinoFinnishFrenchFrench American IndianFrench CanadianGermanGerman RussianGhanaianGreekGuamanian/ChamorroGuatemalanGuyaneseHaitianHmongHonduranHopiHoumaHungarianIcelanderIndian (Asian)IndonesianInupiatIranianIraqiIrishIroquoisIsraeliItalianJamaicanJapaneseJordanianKenyanKiowaKoreanLaotianLatvianLebaneseLiberianLithuanianLumbeeLuxembourgerMacedonianMalaysianMalteseMarshalleseMenomineeMexicanMexican American IndianMongolianMoroccanNative HawaiianNavajoNepaleseNew ZealanderNicaraguanNigerianNorthern EuropeanNorwegianOkinawanOsageOttawaPaiutePakistaniPalestinianPanamanianParaguayanPennsylvania GermanPeruvianPimaPolishPortuguesePotawatomiPuebloPuerto RicanPuget Sound SalishRomanianRussianSalvadoranSamoanScandinavianScotch-IrishScottishSeminoleSenegaleseSerbianShoshoneSiouxSlavicSlovakSloveneSomaliSouth AfricanSouth AmericanSouth American IndianSoviet UnionSpaniardSpanishSpanish AmericanSpanish American IndianSri LankanSubsaharan AfricanSudaneseSwedishSwissSyrianTaiwaneseThaiTlingit-HaidaTohono O'OdhamTonganTrinidadian and TobagonianTsimshianTurkishU.S. Virgin IslanderUgandanUkrainianUruguayanUteVenezuelanVietnameseWelshWest IndianYakamaYaquiYugoslavianYumanYup'ikZimbabwean
Immigration
NonimmigrantsImmigrantsAfghanistanAfricaAlbaniaArgentinaArmeniaAsiaAustraliaAustriaBahamasBangladeshBarbadosBelarusBelgiumBelizeBoliviaBosnia and HerzegovinaBrazilBulgariaBurma/MyanmarCabo VerdeCambodiaCameroonCanadaCaribbeanCentral AmericaChileChinaColombiaCongoCosta RicaCroatiaCubaCzechoslovakiaDenmarkDominicaDominican RepublicEastern AfricaEastern AsiaEastern EuropeEcuadorEgyptEl SalvadorEnglandEritreaEthiopiaEuropeFijiFranceGermanyGhanaGreeceGrenadaGuatemalaGuyanaHaitiHondurasHong KongHungaryIndiaIndonesiaIranIraqIrelandIsraelItalyJamaicaJapanJordanKazakhstanKenyaKoreaKuwaitLaosLatin AmericaLatviaLebanonLiberiaLithuaniaMalaysiaMexicoMicronesiaMiddle AfricaMoldovaMoroccoNepalNetherlandsNicaraguaNigeriaNorth AmericaNorth MacedoniaNorthern AfricaNorthern EuropeNorwayOceaniaPakistanPanamaPeruPhilippinesPolandPortugalRomaniaRussiaSaudi ArabiaScotlandSenegalSerbiaSierra LeoneSingaporeSomaliaSouth AfricaSouth AmericaSouth Central AsiaSouth Eastern AsiaSouthern EuropeSpainSri LankaSt. Vincent and the GrenadinesSudanSwedenSwitzerlandSyriaTaiwanThailandTrinidad and TobagoTurkeyUgandaUkraineUruguayUzbekistanVenezuelaVietnamWest IndiesWestern AfricaWestern AsiaWestern EuropeYemenZaireZimbabweAzores
Sierra Leonean
Race
Ancestry
AfghanAfricanAlaska NativeAlaskan AthabascanAlbanianAleutAlsatianAmericanApacheArabArapahoArgentineanArmenianAssyrian/Chaldean/SyriacAustralianAustrianBahamianBangladeshiBarbadianBasqueBelgianBelizeanBermudanBhutaneseBlackfeetBolivianBrazilianBritishBritish West IndianBulgarianBurmeseCajunCambodianCanadianCape VerdeanCarpatho RusynCelticCentral AmericanCentral American IndianCherokeeCheyenneChickasawChileanChineseChippewaChoctawColombianColvilleComancheCosta RicanCreeCreekCroatianCrowCubanCypriotCzechCzechoslovakianDanishDelawareDominicanDutchDutch West IndianEastern EuropeanEcuadorianEgyptianEnglishEstonianEthiopianEuropeanFijianFilipinoFinnishFrenchFrench American IndianFrench CanadianGermanGerman RussianGhanaianGreekGuamanian/ChamorroGuatemalanGuyaneseHaitianHmongHonduranHopiHoumaHungarianIcelanderIndian (Asian)IndonesianInupiatIranianIraqiIrishIroquoisIsraeliItalianJamaicanJapaneseJordanianKenyanKiowaKoreanLaotianLatvianLebaneseLiberianLithuanianLumbeeLuxembourgerMacedonianMalaysianMalteseMarshalleseMenomineeMexicanMexican American IndianMongolianMoroccanNative HawaiianNavajoNepaleseNew ZealanderNicaraguanNigerianNorthern EuropeanNorwegianOkinawanOsageOttawaPaiutePakistaniPalestinianPanamanianParaguayanPennsylvania GermanPeruvianPimaPolishPortuguesePotawatomiPuebloPuerto RicanPuget Sound SalishRomanianRussianSalvadoranSamoanScandinavianScotch-IrishScottishSeminoleSenegaleseSerbianShoshoneSierra LeoneanSiouxSlavicSlovakSloveneSomaliSouth AfricanSouth AmericanSouth American IndianSoviet UnionSpaniardSpanishSpanish AmericanSpanish American IndianSri LankanSubsaharan AfricanSudaneseSwedishSwissSyrianTaiwaneseThaiTlingit-HaidaTohono O'OdhamTonganTrinidadian and TobagonianTsimshianTurkishU.S. Virgin IslanderUgandanUkrainianUruguayanUteVenezuelanVietnameseWelshWest IndianYakamaYaquiYugoslavianYumanYup'ikZimbabwean
Immigration
NonimmigrantsImmigrantsAfghanistanAfricaAlbaniaArgentinaArmeniaAsiaAustraliaAustriaBahamasBangladeshBarbadosBelarusBelgiumBelizeBoliviaBosnia and HerzegovinaBulgariaBurma/MyanmarCabo VerdeCambodiaCameroonCanadaCaribbeanCentral AmericaChileChinaColombiaCongoCosta RicaCroatiaCubaCzechoslovakiaDenmarkDominicaDominican RepublicEastern AfricaEastern AsiaEastern EuropeEcuadorEgyptEl SalvadorEnglandEritreaEthiopiaEuropeFijiFranceGermanyGhanaGreeceGrenadaGuatemalaGuyanaHaitiHondurasHong KongHungaryIndiaIndonesiaIranIraqIrelandIsraelItalyJamaicaJapanJordanKazakhstanKenyaKoreaKuwaitLaosLatin AmericaLatviaLebanonLiberiaLithuaniaMalaysiaMexicoMicronesiaMiddle AfricaMoldovaMoroccoNepalNetherlandsNicaraguaNigeriaNorth AmericaNorth MacedoniaNorthern AfricaNorthern EuropeNorwayOceaniaPakistanPanamaPeruPhilippinesPolandPortugalRomaniaRussiaSaudi ArabiaScotlandSenegalSerbiaSierra LeoneSingaporeSomaliaSouth AfricaSouth AmericaSouth Central AsiaSouth Eastern AsiaSouthern EuropeSpainSri LankaSt. Vincent and the GrenadinesSudanSwedenSwitzerlandSyriaTaiwanThailandTrinidad and TobagoTurkeyUgandaUkraineUruguayUzbekistanVenezuelaVietnamWest IndiesWestern AfricaWestern AsiaWestern EuropeYemenZaireZimbabweAzores
In Labor Force | Age 20-64
Income
Poverty
Unemployment
Labor Participation
Family Structure
Vehicle Availability
Education Level
Disability

In Labor Force | Age 20-64 Comparison

Immigrants from Brazil

Sierra Leoneans

Exceptional
Exceptional
80.7%
IN LABOR FORCE | AGE 20-64
99.9/ 100
METRIC RATING
34th/ 347
METRIC RANK
81.5%
IN LABOR FORCE | AGE 20-64
100.0/ 100
METRIC RATING
9th/ 347
METRIC RANK

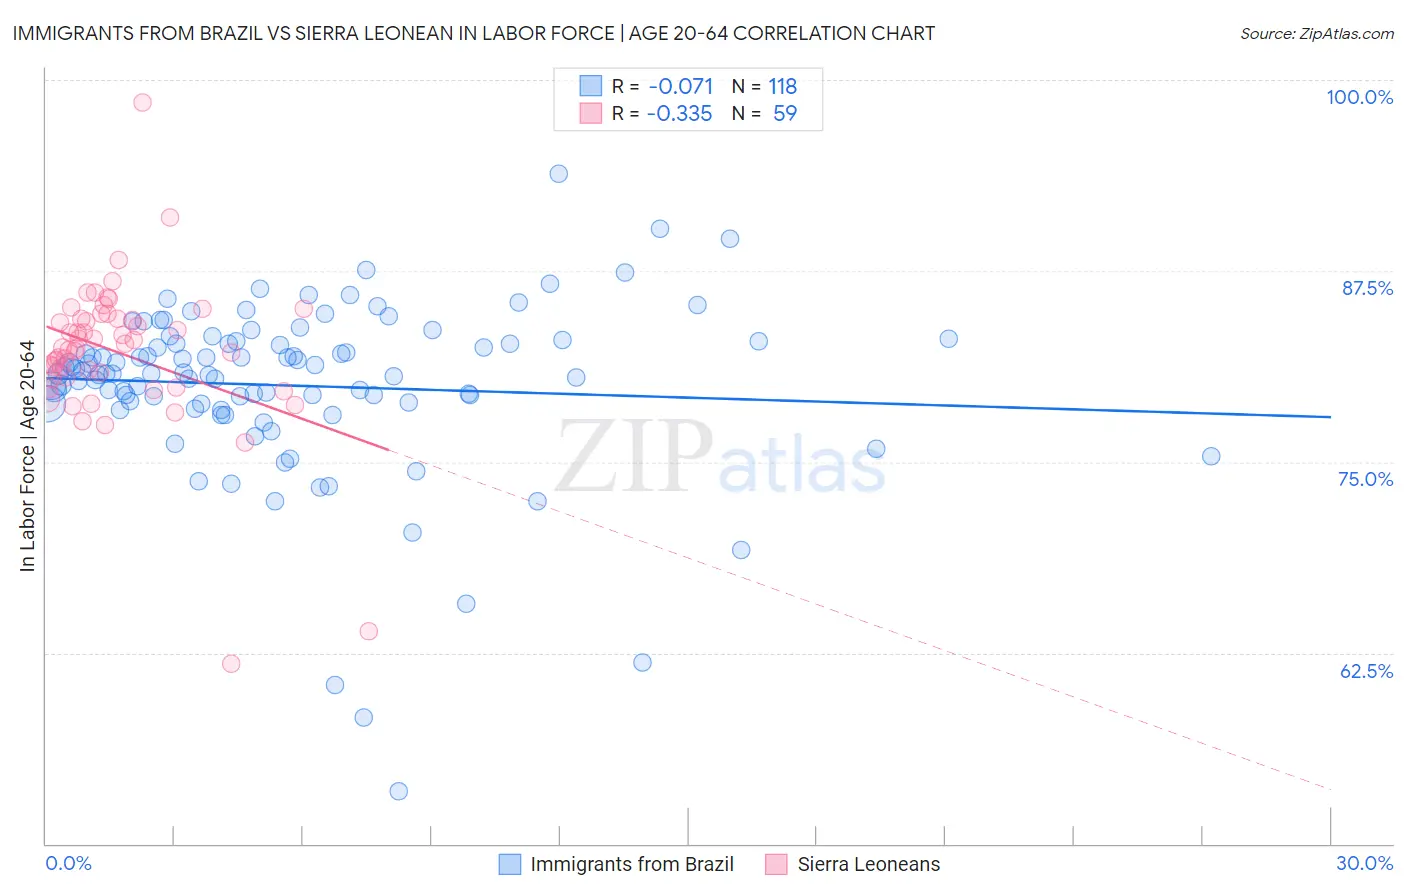
Immigrants from Brazil vs Sierra Leonean In Labor Force | Age 20-64 Correlation Chart

The statistical analysis conducted on geographies consisting of 343,008,665 people shows a slight negative correlation between the proportion of Immigrants from Brazil and labor force participation rate among population between the ages 20 and 64 in the United States with a correlation coefficient (R) of -0.071 and weighted average of 80.7%. Similarly, the statistical analysis conducted on geographies consisting of 83,359,639 people shows a mild negative correlation between the proportion of Sierra Leoneans and labor force participation rate among population between the ages 20 and 64 in the United States with a correlation coefficient (R) of -0.335 and weighted average of 81.5%, a difference of 1.1%.
Immigrants from Brazil vs Sierra Leonean In Labor Force | Age 20-64

In Labor Force | Age 20-64 Correlation Summary

MeasurementImmigrants from BrazilSierra Leonean
Minimum53.4%61.8%
Maximum93.9%98.5%
Range40.5%36.7%
Mean80.0%82.2%
Median80.8%82.4%
Interquartile 25% (IQ1)78.8%80.4%
Interquartile 75% (IQ3)82.9%84.4%
Interquartile Range (IQR)4.1%4.0%
Standard Deviation (Sample)5.8%5.0%
Standard Deviation (Population)5.8%5.0%

Similar Demographics by In Labor Force | Age 20-64

Demographics Similar to Immigrants from Brazil by In Labor Force | Age 20-64

In terms of in labor force | age 20-64, the demographic groups most similar to Immigrants from Brazil are Chinese (80.7%, a difference of 0.020%), Immigrants from Poland (80.6%, a difference of 0.030%), Immigrants from Ireland (80.7%, a difference of 0.060%), Immigrants from Lithuania (80.7%, a difference of 0.070%), and Immigrants from South Central Asia (80.7%, a difference of 0.090%).
DemographicsRating | RankIn Labor Force | Age 20-64
Immigrants | Kenya
99.9
/100
|
#27
Exceptional
80.7%
Immigrants | Uganda
99.9
/100
|
#28
Exceptional
80.7%
Immigrants | South Central Asia
99.9
/100
|
#29
Exceptional
80.7%
Immigrants | North Macedonia
99.9
/100
|
#30
Exceptional
80.7%
Immigrants | Lithuania
99.9
/100
|
#31
Exceptional
80.7%
Immigrants | Ireland
99.9
/100
|
#32
Exceptional
80.7%
Chinese
99.9
/100
|
#33
Exceptional
80.7%
Immigrants | Brazil
99.9
/100
|
#34
Exceptional
80.7%
Immigrants | Poland
99.9
/100
|
#35
Exceptional
80.6%
Paraguayans
99.8
/100
|
#36
Exceptional
80.6%
Immigrants | Moldova
99.8
/100
|
#37
Exceptional
80.6%
Ugandans
99.8
/100
|
#38
Exceptional
80.6%
Brazilians
99.8
/100
|
#39
Exceptional
80.5%
Immigrants | Zimbabwe
99.8
/100
|
#40
Exceptional
80.5%
Immigrants | Liberia
99.8
/100
|
#41
Exceptional
80.5%

Demographics Similar to Sierra Leoneans by In Labor Force | Age 20-64

In terms of in labor force | age 20-64, the demographic groups most similar to Sierra Leoneans are Immigrants from Somalia (81.6%, a difference of 0.0%), Immigrants from Cameroon (81.6%, a difference of 0.020%), Somali (81.6%, a difference of 0.060%), Immigrants from Sierra Leone (81.5%, a difference of 0.12%), and Bolivian (81.7%, a difference of 0.17%).
DemographicsRating | RankIn Labor Force | Age 20-64
Ethiopians
100.0
/100
|
#2
Exceptional
82.0%
Immigrants | Bolivia
100.0
/100
|
#3
Exceptional
81.9%
Luxembourgers
100.0
/100
|
#4
Exceptional
81.9%
Bolivians
100.0
/100
|
#5
Exceptional
81.7%
Somalis
100.0
/100
|
#6
Exceptional
81.6%
Immigrants | Cameroon
100.0
/100
|
#7
Exceptional
81.6%
Immigrants | Somalia
100.0
/100
|
#8
Exceptional
81.6%
Sierra Leoneans
100.0
/100
|
#9
Exceptional
81.5%
Immigrants | Sierra Leone
100.0
/100
|
#10
Exceptional
81.5%
Immigrants | Eastern Africa
100.0
/100
|
#11
Exceptional
81.3%
Immigrants | Eritrea
100.0
/100
|
#12
Exceptional
81.3%
Immigrants | India
100.0
/100
|
#13
Exceptional
81.3%
Cambodians
100.0
/100
|
#14
Exceptional
81.1%
Bulgarians
100.0
/100
|
#15
Exceptional
81.1%
Immigrants | Nepal
100.0
/100
|
#16
Exceptional
81.1%