German vs Venezuelan In Labor Force | Age 25-29
COMPARE
German
Venezuelan
In Labor Force | Age 25-29
In Labor Force | Age 25-29 Comparison
Germans
Venezuelans
85.3%
IN LABOR FORCE | AGE 25-29
98.1/ 100
METRIC RATING
76th/ 347
METRIC RANK
84.4%
IN LABOR FORCE | AGE 25-29
15.1/ 100
METRIC RATING
204th/ 347
METRIC RANK
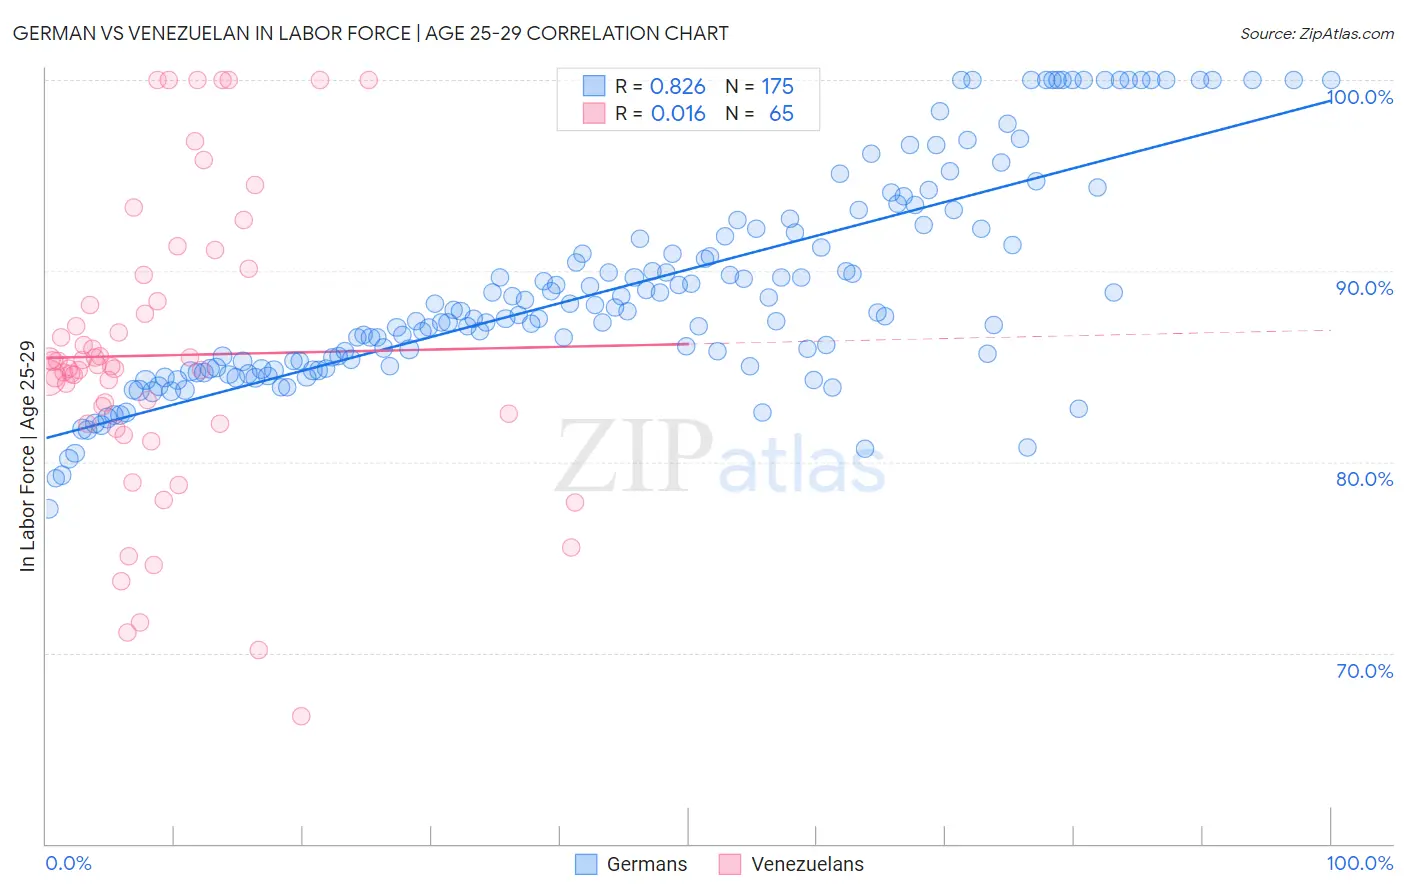
German vs Venezuelan In Labor Force | Age 25-29 Correlation Chart
The statistical analysis conducted on geographies consisting of 579,041,813 people shows a very strong positive correlation between the proportion of Germans and labor force participation rate among population between the ages 25 and 29 in the United States with a correlation coefficient (R) of 0.826 and weighted average of 85.3%. Similarly, the statistical analysis conducted on geographies consisting of 306,279,801 people shows no correlation between the proportion of Venezuelans and labor force participation rate among population between the ages 25 and 29 in the United States with a correlation coefficient (R) of 0.016 and weighted average of 84.4%, a difference of 1.0%.
In Labor Force | Age 25-29 Correlation Summary
| Measurement | German | Venezuelan |
| Minimum | 77.6% | 66.7% |
| Maximum | 100.0% | 100.0% |
| Range | 22.4% | 33.3% |
| Mean | 89.0% | 85.6% |
| Median | 87.7% | 85.0% |
| Interquartile 25% (IQ1) | 84.9% | 82.0% |
| Interquartile 75% (IQ3) | 92.2% | 89.1% |
| Interquartile Range (IQR) | 7.3% | 7.1% |
| Standard Deviation (Sample) | 5.5% | 7.7% |
| Standard Deviation (Population) | 5.5% | 7.6% |
Similar Demographics by In Labor Force | Age 25-29
Demographics Similar to Germans by In Labor Force | Age 25-29
In terms of in labor force | age 25-29, the demographic groups most similar to Germans are Brazilian (85.3%, a difference of 0.020%), Immigrants from South Central Asia (85.2%, a difference of 0.020%), Immigrants from Egypt (85.2%, a difference of 0.030%), Immigrants from Northern Africa (85.2%, a difference of 0.040%), and Immigrants from Zimbabwe (85.2%, a difference of 0.040%).
| Demographics | Rating | Rank | In Labor Force | Age 25-29 |
| Menominee | 99.1 /100 | #69 | Exceptional 85.4% |
| Immigrants | Sweden | 99.1 /100 | #70 | Exceptional 85.4% |
| Kenyans | 99.0 /100 | #71 | Exceptional 85.4% |
| Immigrants | Australia | 98.9 /100 | #72 | Exceptional 85.3% |
| Russians | 98.8 /100 | #73 | Exceptional 85.3% |
| Soviet Union | 98.5 /100 | #74 | Exceptional 85.3% |
| Brazilians | 98.3 /100 | #75 | Exceptional 85.3% |
| Germans | 98.1 /100 | #76 | Exceptional 85.3% |
| Immigrants | South Central Asia | 97.9 /100 | #77 | Exceptional 85.2% |
| Immigrants | Egypt | 97.7 /100 | #78 | Exceptional 85.2% |
| Immigrants | Northern Africa | 97.6 /100 | #79 | Exceptional 85.2% |
| Immigrants | Zimbabwe | 97.6 /100 | #80 | Exceptional 85.2% |
| Immigrants | Northern Europe | 97.2 /100 | #81 | Exceptional 85.2% |
| Okinawans | 97.0 /100 | #82 | Exceptional 85.2% |
| Immigrants | Europe | 96.8 /100 | #83 | Exceptional 85.2% |
Demographics Similar to Venezuelans by In Labor Force | Age 25-29
In terms of in labor force | age 25-29, the demographic groups most similar to Venezuelans are Ecuadorian (84.4%, a difference of 0.0%), Afghan (84.4%, a difference of 0.010%), Immigrants from Afghanistan (84.4%, a difference of 0.010%), Immigrants from Cambodia (84.4%, a difference of 0.010%), and Laotian (84.4%, a difference of 0.020%).
| Demographics | Rating | Rank | In Labor Force | Age 25-29 |
| Tlingit-Haida | 19.3 /100 | #197 | Poor 84.4% |
| Immigrants | Iraq | 19.0 /100 | #198 | Poor 84.4% |
| Immigrants | Germany | 18.3 /100 | #199 | Poor 84.4% |
| Immigrants | Kazakhstan | 17.5 /100 | #200 | Poor 84.4% |
| Laotians | 16.6 /100 | #201 | Poor 84.4% |
| Afghans | 15.9 /100 | #202 | Poor 84.4% |
| Immigrants | Afghanistan | 15.6 /100 | #203 | Poor 84.4% |
| Venezuelans | 15.1 /100 | #204 | Poor 84.4% |
| Ecuadorians | 14.8 /100 | #205 | Poor 84.4% |
| Immigrants | Cambodia | 14.3 /100 | #206 | Poor 84.4% |
| Immigrants | Armenia | 13.3 /100 | #207 | Poor 84.4% |
| Immigrants | Indonesia | 13.2 /100 | #208 | Poor 84.4% |
| Immigrants | Jordan | 12.8 /100 | #209 | Poor 84.4% |
| Chinese | 12.7 /100 | #210 | Poor 84.3% |
| Immigrants | Venezuela | 12.6 /100 | #211 | Poor 84.3% |