Zip Codes with the Highest Percentage of Population with a Degree in Liberal Arts and History in Olathe, KS
RELATED REPORTS & OPTIONS
Liberal Arts and History
Olathe
Compare Zip Codes
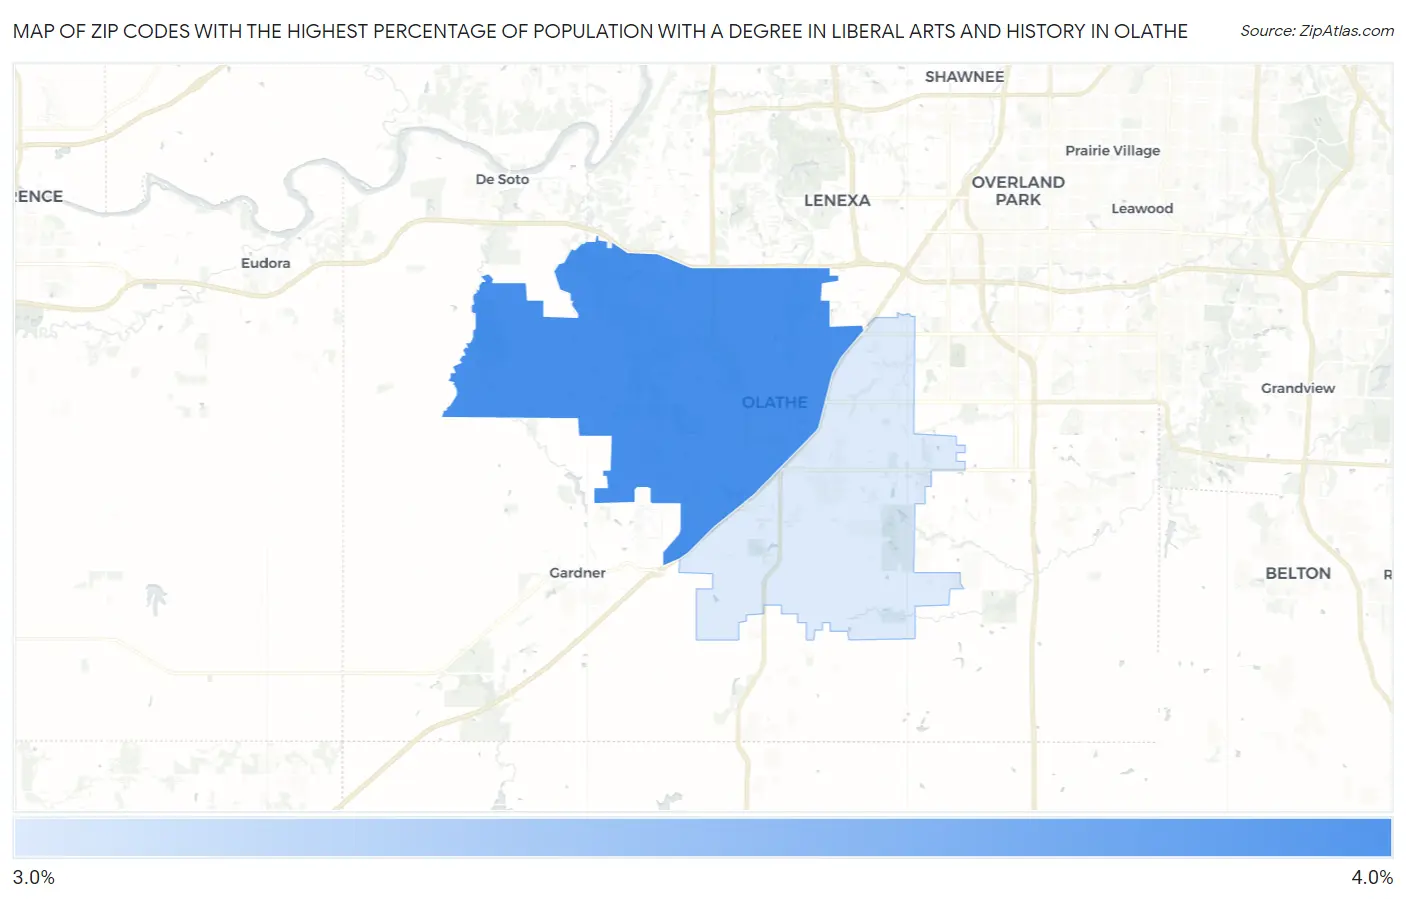
Map of Zip Codes with the Highest Percentage of Population with a Degree in Liberal Arts and History in Olathe
0.0%
4.0%
Zip Codes with the Highest Percentage of Population with a Degree in Liberal Arts and History in Olathe, KS
| Zip Code | % Graduates | vs State | vs National | |
| 1. | 66061 | 3.6% | 4.6%(-0.928)#287 | 4.9%(-1.24)#16,128 |
| 2. | 66062 | 3.6% | 4.6%(-0.995)#292 | 4.9%(-1.31)#16,366 |
1
Common Questions
What are the Top Zip Codes with the Highest Percentage of Population with a Degree in Liberal Arts and History in Olathe, KS?
Top Zip Codes with the Highest Percentage of Population with a Degree in Liberal Arts and History in Olathe, KS are:
What zip code has the Highest Percentage of Population with a Degree in Liberal Arts and History in Olathe, KS?
66061 has the Highest Percentage of Population with a Degree in Liberal Arts and History in Olathe, KS with 3.6%.
What is the Percentage of Population with a Degree in Liberal Arts and History in Olathe, KS?
Percentage of Population with a Degree in Liberal Arts and History in Olathe is 3.6%.
What is the Percentage of Population with a Degree in Liberal Arts and History in Kansas?
Percentage of Population with a Degree in Liberal Arts and History in Kansas is 4.6%.
What is the Percentage of Population with a Degree in Liberal Arts and History in the United States?
Percentage of Population with a Degree in Liberal Arts and History in the United States is 4.9%.