Slavic vs Immigrants from Russia Median Earnings
COMPARE
Slavic
Immigrants from Russia
Median Earnings
Median Earnings Comparison
Slavs
Immigrants from Russia
$47,470
MEDIAN EARNINGS
81.1/ 100
METRIC RATING
153rd/ 347
METRIC RANK
$53,457
MEDIAN EARNINGS
100.0/ 100
METRIC RATING
29th/ 347
METRIC RANK
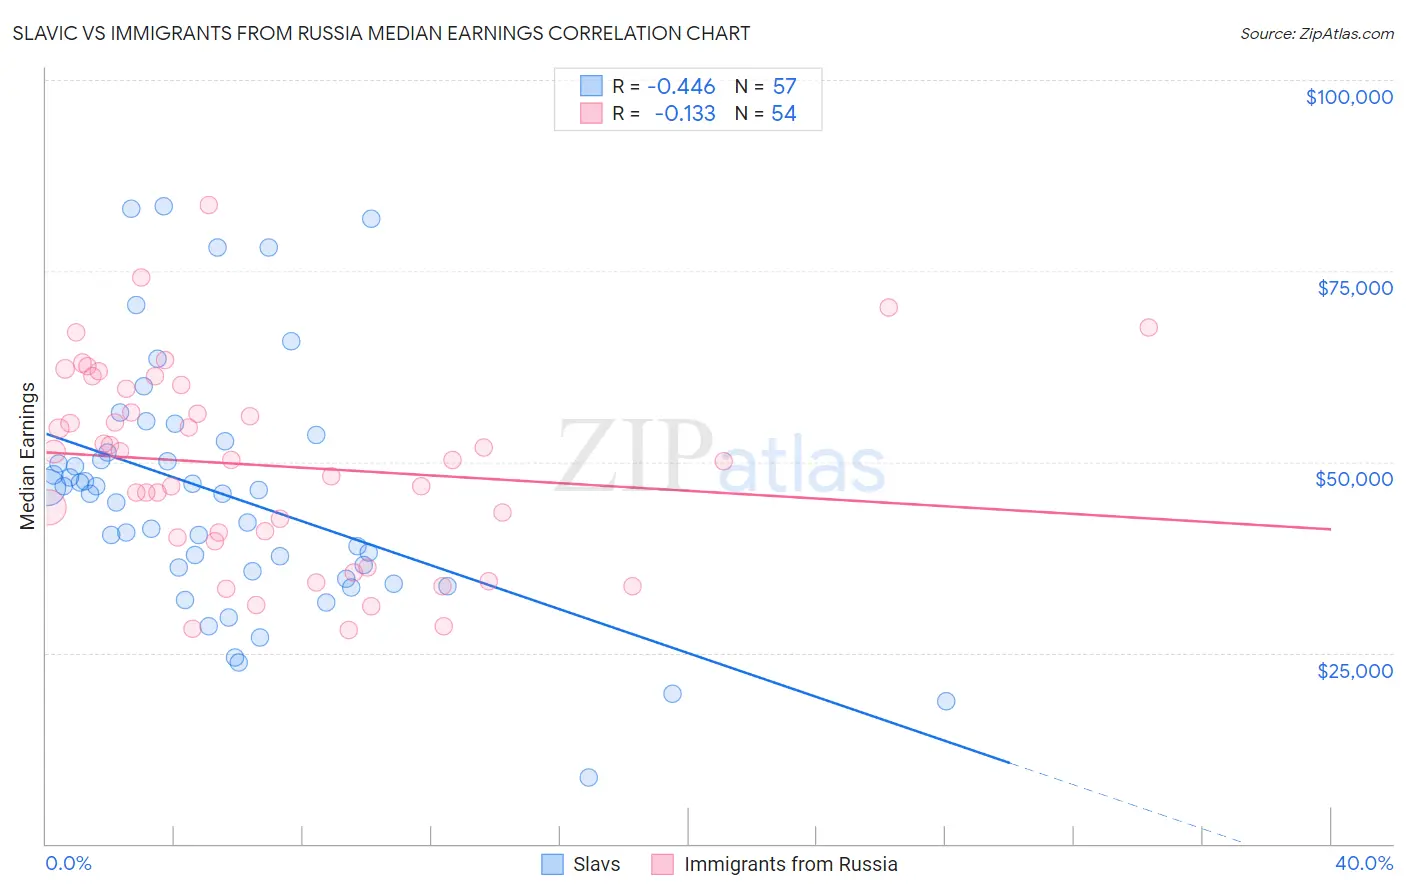
Slavic vs Immigrants from Russia Median Earnings Correlation Chart
The statistical analysis conducted on geographies consisting of 270,868,378 people shows a moderate negative correlation between the proportion of Slavs and median earnings in the United States with a correlation coefficient (R) of -0.446 and weighted average of $47,470. Similarly, the statistical analysis conducted on geographies consisting of 347,936,772 people shows a poor negative correlation between the proportion of Immigrants from Russia and median earnings in the United States with a correlation coefficient (R) of -0.133 and weighted average of $53,457, a difference of 12.6%.
Median Earnings Correlation Summary
| Measurement | Slavic | Immigrants from Russia |
| Minimum | $8,672 | $27,990 |
| Maximum | $83,496 | $83,702 |
| Range | $74,824 | $55,712 |
| Mean | $45,520 | $49,525 |
| Median | $45,848 | $50,229 |
| Interquartile 25% (IQ1) | $35,213 | $40,169 |
| Interquartile 75% (IQ3) | $51,961 | $59,535 |
| Interquartile Range (IQR) | $16,749 | $19,366 |
| Standard Deviation (Sample) | $16,076 | $12,722 |
| Standard Deviation (Population) | $15,935 | $12,603 |
Similar Demographics by Median Earnings
Demographics Similar to Slavs by Median Earnings
In terms of median earnings, the demographic groups most similar to Slavs are Immigrants from Germany ($47,566, a difference of 0.20%), Immigrants from Oceania ($47,617, a difference of 0.31%), Peruvian ($47,628, a difference of 0.33%), Immigrants from Portugal ($47,304, a difference of 0.35%), and Luxembourger ($47,640, a difference of 0.36%).
| Demographics | Rating | Rank | Median Earnings |
| Immigrants | Chile | 85.5 /100 | #146 | Excellent $47,697 |
| Immigrants | South Eastern Asia | 85.0 /100 | #147 | Excellent $47,671 |
| Immigrants | Eritrea | 84.8 /100 | #148 | Excellent $47,657 |
| Luxembourgers | 84.5 /100 | #149 | Excellent $47,640 |
| Peruvians | 84.2 /100 | #150 | Excellent $47,628 |
| Immigrants | Oceania | 84.1 /100 | #151 | Excellent $47,617 |
| Immigrants | Germany | 83.1 /100 | #152 | Excellent $47,566 |
| Slavs | 81.1 /100 | #153 | Excellent $47,470 |
| Immigrants | Portugal | 77.3 /100 | #154 | Good $47,304 |
| Immigrants | Vietnam | 76.7 /100 | #155 | Good $47,282 |
| Irish | 76.6 /100 | #156 | Good $47,276 |
| Czechs | 75.1 /100 | #157 | Good $47,221 |
| Slovaks | 71.7 /100 | #158 | Good $47,095 |
| Immigrants | Peru | 69.6 /100 | #159 | Good $47,025 |
| Alsatians | 69.6 /100 | #160 | Good $47,023 |
Demographics Similar to Immigrants from Russia by Median Earnings
In terms of median earnings, the demographic groups most similar to Immigrants from Russia are Immigrants from France ($53,490, a difference of 0.060%), Cambodian ($53,386, a difference of 0.13%), Russian ($53,334, a difference of 0.23%), Immigrants from Asia ($53,310, a difference of 0.28%), and Immigrants from Greece ($53,282, a difference of 0.33%).
| Demographics | Rating | Rank | Median Earnings |
| Immigrants | Korea | 100.0 /100 | #22 | Exceptional $54,530 |
| Immigrants | Sweden | 100.0 /100 | #23 | Exceptional $54,478 |
| Soviet Union | 100.0 /100 | #24 | Exceptional $54,290 |
| Turks | 100.0 /100 | #25 | Exceptional $53,919 |
| Immigrants | Northern Europe | 100.0 /100 | #26 | Exceptional $53,872 |
| Asians | 100.0 /100 | #27 | Exceptional $53,690 |
| Immigrants | France | 100.0 /100 | #28 | Exceptional $53,490 |
| Immigrants | Russia | 100.0 /100 | #29 | Exceptional $53,457 |
| Cambodians | 100.0 /100 | #30 | Exceptional $53,386 |
| Russians | 100.0 /100 | #31 | Exceptional $53,334 |
| Immigrants | Asia | 100.0 /100 | #32 | Exceptional $53,310 |
| Immigrants | Greece | 100.0 /100 | #33 | Exceptional $53,282 |
| Immigrants | Sri Lanka | 100.0 /100 | #34 | Exceptional $53,268 |
| Immigrants | Switzerland | 100.0 /100 | #35 | Exceptional $53,211 |
| Immigrants | Denmark | 100.0 /100 | #36 | Exceptional $53,186 |