Choctaw vs Immigrants from Russia Median Earnings
COMPARE
Choctaw
Immigrants from Russia
Median Earnings
Median Earnings Comparison
Choctaw
Immigrants from Russia
$40,270
MEDIAN EARNINGS
0.0/ 100
METRIC RATING
313th/ 347
METRIC RANK
$53,457
MEDIAN EARNINGS
100.0/ 100
METRIC RATING
29th/ 347
METRIC RANK
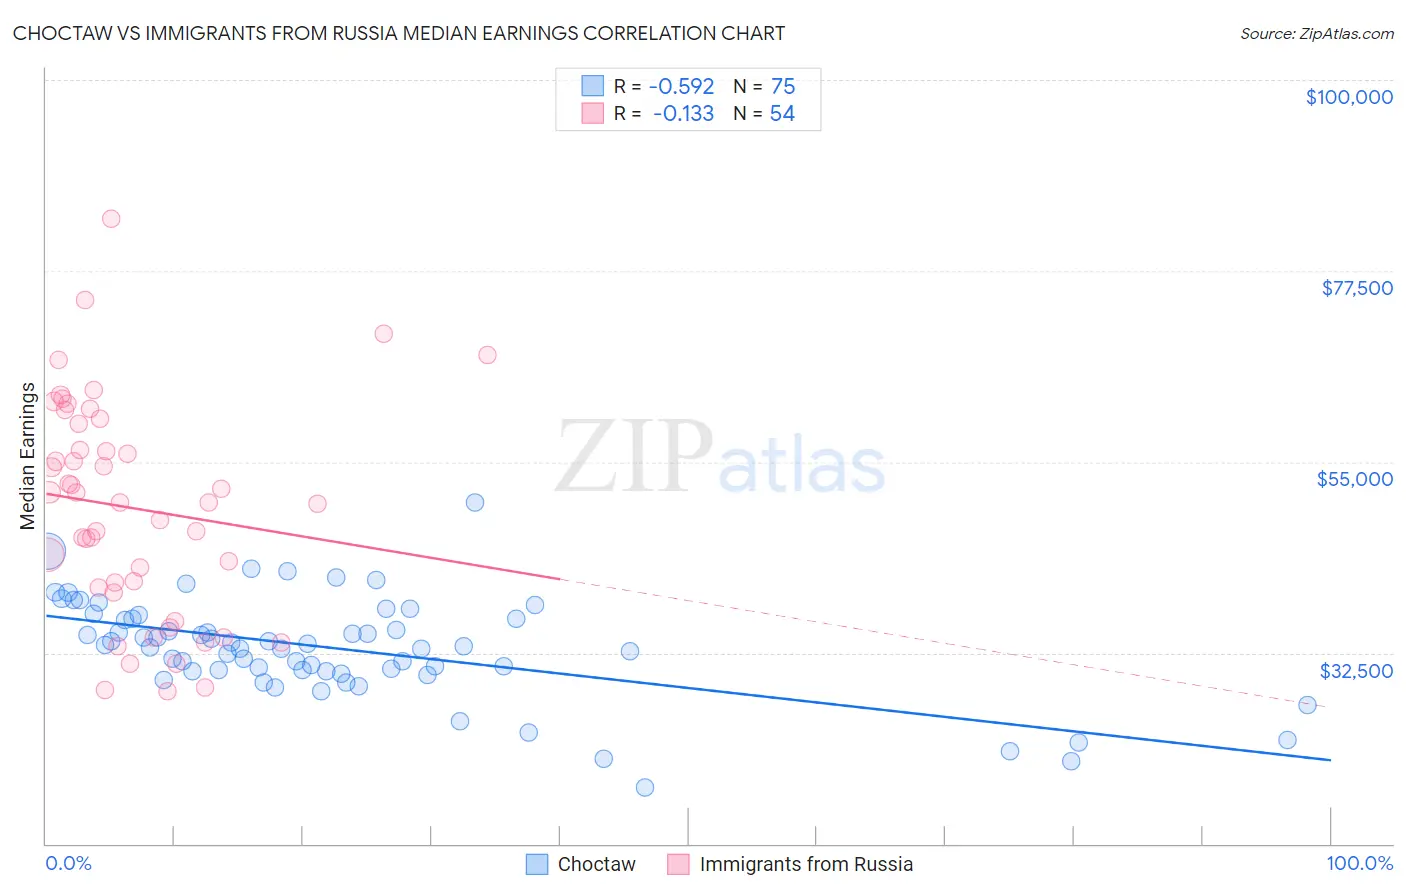
Choctaw vs Immigrants from Russia Median Earnings Correlation Chart
The statistical analysis conducted on geographies consisting of 269,709,236 people shows a substantial negative correlation between the proportion of Choctaw and median earnings in the United States with a correlation coefficient (R) of -0.592 and weighted average of $40,270. Similarly, the statistical analysis conducted on geographies consisting of 347,936,772 people shows a poor negative correlation between the proportion of Immigrants from Russia and median earnings in the United States with a correlation coefficient (R) of -0.133 and weighted average of $53,457, a difference of 32.8%.
Median Earnings Correlation Summary
| Measurement | Choctaw | Immigrants from Russia |
| Minimum | $16,607 | $27,990 |
| Maximum | $50,240 | $83,702 |
| Range | $33,633 | $55,712 |
| Mean | $33,003 | $49,525 |
| Median | $33,256 | $50,229 |
| Interquartile 25% (IQ1) | $30,391 | $40,169 |
| Interquartile 75% (IQ3) | $36,563 | $59,535 |
| Interquartile Range (IQR) | $6,172 | $19,366 |
| Standard Deviation (Sample) | $5,920 | $12,722 |
| Standard Deviation (Population) | $5,880 | $12,603 |
Similar Demographics by Median Earnings
Demographics Similar to Choctaw by Median Earnings
In terms of median earnings, the demographic groups most similar to Choctaw are Hispanic or Latino ($40,288, a difference of 0.040%), Chippewa ($40,287, a difference of 0.040%), Cheyenne ($40,233, a difference of 0.090%), Seminole ($40,233, a difference of 0.090%), and Immigrants from Honduras ($40,195, a difference of 0.19%).
| Demographics | Rating | Rank | Median Earnings |
| Yaqui | 0.0 /100 | #306 | Tragic $40,647 |
| Hondurans | 0.0 /100 | #307 | Tragic $40,638 |
| Cubans | 0.0 /100 | #308 | Tragic $40,619 |
| Immigrants | Haiti | 0.0 /100 | #309 | Tragic $40,550 |
| Apache | 0.0 /100 | #310 | Tragic $40,388 |
| Hispanics or Latinos | 0.0 /100 | #311 | Tragic $40,288 |
| Chippewa | 0.0 /100 | #312 | Tragic $40,287 |
| Choctaw | 0.0 /100 | #313 | Tragic $40,270 |
| Cheyenne | 0.0 /100 | #314 | Tragic $40,233 |
| Seminole | 0.0 /100 | #315 | Tragic $40,233 |
| Immigrants | Honduras | 0.0 /100 | #316 | Tragic $40,195 |
| Fijians | 0.0 /100 | #317 | Tragic $40,193 |
| Dutch West Indians | 0.0 /100 | #318 | Tragic $40,107 |
| Blacks/African Americans | 0.0 /100 | #319 | Tragic $40,085 |
| Immigrants | Bahamas | 0.0 /100 | #320 | Tragic $39,861 |
Demographics Similar to Immigrants from Russia by Median Earnings
In terms of median earnings, the demographic groups most similar to Immigrants from Russia are Immigrants from France ($53,490, a difference of 0.060%), Cambodian ($53,386, a difference of 0.13%), Russian ($53,334, a difference of 0.23%), Immigrants from Asia ($53,310, a difference of 0.28%), and Immigrants from Greece ($53,282, a difference of 0.33%).
| Demographics | Rating | Rank | Median Earnings |
| Immigrants | Korea | 100.0 /100 | #22 | Exceptional $54,530 |
| Immigrants | Sweden | 100.0 /100 | #23 | Exceptional $54,478 |
| Soviet Union | 100.0 /100 | #24 | Exceptional $54,290 |
| Turks | 100.0 /100 | #25 | Exceptional $53,919 |
| Immigrants | Northern Europe | 100.0 /100 | #26 | Exceptional $53,872 |
| Asians | 100.0 /100 | #27 | Exceptional $53,690 |
| Immigrants | France | 100.0 /100 | #28 | Exceptional $53,490 |
| Immigrants | Russia | 100.0 /100 | #29 | Exceptional $53,457 |
| Cambodians | 100.0 /100 | #30 | Exceptional $53,386 |
| Russians | 100.0 /100 | #31 | Exceptional $53,334 |
| Immigrants | Asia | 100.0 /100 | #32 | Exceptional $53,310 |
| Immigrants | Greece | 100.0 /100 | #33 | Exceptional $53,282 |
| Immigrants | Sri Lanka | 100.0 /100 | #34 | Exceptional $53,268 |
| Immigrants | Switzerland | 100.0 /100 | #35 | Exceptional $53,211 |
| Immigrants | Denmark | 100.0 /100 | #36 | Exceptional $53,186 |