Chinese vs Immigrants from Russia Median Earnings

COMPARE

Chinese
Race
Ancestry
AfghanAfricanAlaska NativeAlaskan AthabascanAlbanianAleutAlsatianAmericanApacheArabArapahoArgentineanArmenianAssyrian/Chaldean/SyriacAustralianAustrianBahamianBangladeshiBarbadianBasqueBelgianBelizeanBermudanBhutaneseBlackfeetBolivianBrazilianBritishBritish West IndianBulgarianBurmeseCajunCambodianCanadianCape VerdeanCarpatho RusynCelticCentral AmericanCentral American IndianCherokeeCheyenneChickasawChileanChineseChippewaChoctawColombianColvilleComancheCosta RicanCreeCreekCroatianCrowCubanCypriotCzechCzechoslovakianDanishDelawareDominicanDutchDutch West IndianEastern EuropeanEcuadorianEgyptianEnglishEstonianEthiopianEuropeanFijianFilipinoFinnishFrenchFrench American IndianFrench CanadianGermanGerman RussianGhanaianGreekGuamanian/ChamorroGuatemalanGuyaneseHaitianHmongHonduranHopiHoumaHungarianIcelanderIndian (Asian)IndonesianInupiatIranianIraqiIrishIroquoisIsraeliItalianJamaicanJapaneseJordanianKenyanKiowaKoreanLaotianLatvianLebaneseLiberianLithuanianLumbeeLuxembourgerMacedonianMalaysianMalteseMarshalleseMenomineeMexicanMexican American IndianMongolianMoroccanNative HawaiianNavajoNepaleseNew ZealanderNicaraguanNigerianNorthern EuropeanNorwegianOkinawanOsageOttawaPaiutePakistaniPalestinianPanamanianParaguayanPennsylvania GermanPeruvianPimaPolishPortuguesePotawatomiPuebloPuerto RicanPuget Sound SalishRomanianRussianSalvadoranSamoanScandinavianScotch-IrishScottishSeminoleSenegaleseSerbianShoshoneSierra LeoneanSiouxSlavicSlovakSloveneSomaliSouth AfricanSouth AmericanSouth American IndianSoviet UnionSpaniardSpanishSpanish AmericanSpanish American IndianSri LankanSubsaharan AfricanSudaneseSwedishSwissSyrianTaiwaneseThaiTlingit-HaidaTohono O'OdhamTonganTrinidadian and TobagonianTsimshianTurkishU.S. Virgin IslanderUgandanUkrainianUruguayanUteVenezuelanVietnameseWelshWest IndianYakamaYaquiYugoslavianYumanYup'ikZimbabwean
Immigration
NonimmigrantsImmigrantsAfghanistanAfricaAlbaniaArgentinaArmeniaAsiaAustraliaAustriaBahamasBangladeshBarbadosBelarusBelgiumBelizeBoliviaBosnia and HerzegovinaBrazilBulgariaBurma/MyanmarCabo VerdeCambodiaCameroonCanadaCaribbeanCentral AmericaChileChinaColombiaCongoCosta RicaCroatiaCubaCzechoslovakiaDenmarkDominicaDominican RepublicEastern AfricaEastern AsiaEastern EuropeEcuadorEgyptEl SalvadorEnglandEritreaEthiopiaEuropeFijiFranceGermanyGhanaGreeceGrenadaGuatemalaGuyanaHaitiHondurasHong KongHungaryIndiaIndonesiaIranIraqIrelandIsraelItalyJamaicaJapanJordanKazakhstanKenyaKoreaKuwaitLaosLatin AmericaLatviaLebanonLiberiaLithuaniaMalaysiaMexicoMicronesiaMiddle AfricaMoldovaMoroccoNepalNetherlandsNicaraguaNigeriaNorth AmericaNorth MacedoniaNorthern AfricaNorthern EuropeNorwayOceaniaPakistanPanamaPeruPhilippinesPolandPortugalRomaniaSaudi ArabiaScotlandSenegalSerbiaSierra LeoneSingaporeSomaliaSouth AfricaSouth AmericaSouth Central AsiaSouth Eastern AsiaSouthern EuropeSpainSri LankaSt. Vincent and the GrenadinesSudanSwedenSwitzerlandSyriaTaiwanThailandTrinidad and TobagoTurkeyUgandaUkraineUruguayUzbekistanVenezuelaVietnamWest IndiesWestern AfricaWestern AsiaWestern EuropeYemenZaireZimbabweAzores
Immigrants from Russia
Race
Ancestry
AfghanAfricanAlaska NativeAlaskan AthabascanAlbanianAleutAlsatianAmericanApacheArabArapahoArgentineanArmenianAssyrian/Chaldean/SyriacAustralianAustrianBahamianBangladeshiBarbadianBasqueBelgianBelizeanBermudanBhutaneseBlackfeetBolivianBrazilianBritishBritish West IndianBulgarianBurmeseCajunCambodianCanadianCape VerdeanCarpatho RusynCelticCentral AmericanCentral American IndianCherokeeCheyenneChickasawChileanChippewaChoctawColombianColvilleComancheCosta RicanCreeCreekCroatianCrowCubanCypriotCzechCzechoslovakianDanishDelawareDominicanDutchDutch West IndianEastern EuropeanEcuadorianEgyptianEnglishEstonianEthiopianEuropeanFijianFilipinoFinnishFrenchFrench American IndianFrench CanadianGermanGerman RussianGhanaianGreekGuamanian/ChamorroGuatemalanGuyaneseHaitianHmongHonduranHopiHoumaHungarianIcelanderIndian (Asian)IndonesianInupiatIranianIraqiIrishIroquoisIsraeliItalianJamaicanJapaneseJordanianKenyanKiowaKoreanLaotianLatvianLebaneseLiberianLithuanianLumbeeLuxembourgerMacedonianMalaysianMalteseMarshalleseMenomineeMexicanMexican American IndianMongolianMoroccanNative HawaiianNavajoNepaleseNew ZealanderNicaraguanNigerianNorthern EuropeanNorwegianOkinawanOsageOttawaPaiutePakistaniPalestinianPanamanianParaguayanPennsylvania GermanPeruvianPimaPolishPortuguesePotawatomiPuebloPuerto RicanPuget Sound SalishRomanianRussianSalvadoranSamoanScandinavianScotch-IrishScottishSeminoleSenegaleseSerbianShoshoneSierra LeoneanSiouxSlavicSlovakSloveneSomaliSouth AfricanSouth AmericanSouth American IndianSoviet UnionSpaniardSpanishSpanish AmericanSpanish American IndianSri LankanSubsaharan AfricanSudaneseSwedishSwissSyrianTaiwaneseThaiTlingit-HaidaTohono O'OdhamTonganTrinidadian and TobagonianTsimshianTurkishU.S. Virgin IslanderUgandanUkrainianUruguayanUteVenezuelanVietnameseWelshWest IndianYakamaYaquiYugoslavianYumanYup'ikZimbabwean
Immigration
NonimmigrantsImmigrantsAfghanistanAfricaAlbaniaArgentinaArmeniaAsiaAustraliaAustriaBahamasBangladeshBarbadosBelarusBelgiumBelizeBoliviaBosnia and HerzegovinaBrazilBulgariaBurma/MyanmarCabo VerdeCambodiaCameroonCanadaCaribbeanCentral AmericaChileChinaColombiaCongoCosta RicaCroatiaCubaCzechoslovakiaDenmarkDominicaDominican RepublicEastern AfricaEastern AsiaEastern EuropeEcuadorEgyptEl SalvadorEnglandEritreaEthiopiaEuropeFijiFranceGermanyGhanaGreeceGrenadaGuatemalaGuyanaHaitiHondurasHong KongHungaryIndiaIndonesiaIranIraqIrelandIsraelItalyJamaicaJapanJordanKazakhstanKenyaKoreaKuwaitLaosLatin AmericaLatviaLebanonLiberiaLithuaniaMalaysiaMexicoMicronesiaMiddle AfricaMoldovaMoroccoNepalNetherlandsNicaraguaNigeriaNorth AmericaNorth MacedoniaNorthern AfricaNorthern EuropeNorwayOceaniaPakistanPanamaPeruPhilippinesPolandPortugalRomaniaRussiaSaudi ArabiaScotlandSenegalSerbiaSierra LeoneSingaporeSomaliaSouth AfricaSouth AmericaSouth Central AsiaSouth Eastern AsiaSouthern EuropeSpainSri LankaSt. Vincent and the GrenadinesSudanSwedenSwitzerlandSyriaTaiwanThailandTrinidad and TobagoTurkeyUgandaUkraineUruguayUzbekistanVenezuelaVietnamWest IndiesWestern AfricaWestern AsiaWestern EuropeYemenZaireZimbabweAzores
Median Earnings
Income
Poverty
Unemployment
Labor Participation
Family Structure
Vehicle Availability
Education Level
Disability

Median Earnings Comparison

Chinese

Immigrants from Russia

Exceptional
Exceptional
$48,836
MEDIAN EARNINGS
96.7/ 100
METRIC RATING
115th/ 347
METRIC RANK
$53,457
MEDIAN EARNINGS
100.0/ 100
METRIC RATING
29th/ 347
METRIC RANK

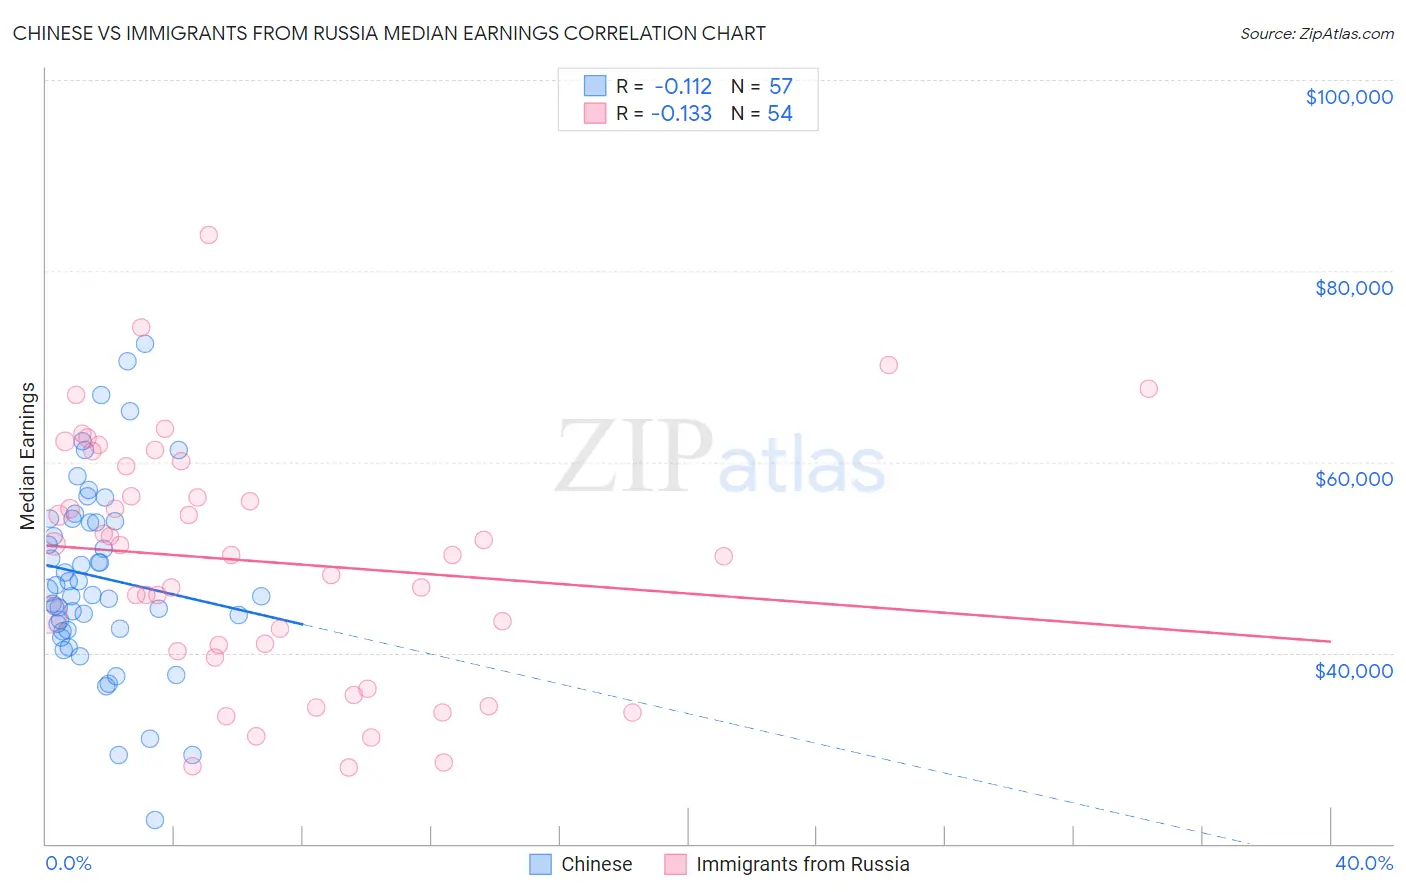
Chinese vs Immigrants from Russia Median Earnings Correlation Chart

The statistical analysis conducted on geographies consisting of 64,808,012 people shows a poor negative correlation between the proportion of Chinese and median earnings in the United States with a correlation coefficient (R) of -0.112 and weighted average of $48,836. Similarly, the statistical analysis conducted on geographies consisting of 347,936,772 people shows a poor negative correlation between the proportion of Immigrants from Russia and median earnings in the United States with a correlation coefficient (R) of -0.133 and weighted average of $53,457, a difference of 9.5%.
Chinese vs Immigrants from Russia Median Earnings

Median Earnings Correlation Summary

MeasurementChineseImmigrants from Russia
Minimum$22,468$27,990
Maximum$72,308$83,702
Range$49,840$55,712
Mean$47,945$49,525
Median$46,556$50,229
Interquartile 25% (IQ1)$42,425$40,169
Interquartile 75% (IQ3)$53,869$59,535
Interquartile Range (IQR)$11,444$19,366
Standard Deviation (Sample)$9,906$12,722
Standard Deviation (Population)$9,819$12,603

Similar Demographics by Median Earnings

Demographics Similar to Chinese by Median Earnings

In terms of median earnings, the demographic groups most similar to Chinese are Moroccan ($48,838, a difference of 0.010%), Immigrants from Kuwait ($48,861, a difference of 0.050%), Northern European ($48,887, a difference of 0.10%), Immigrants from Zimbabwe ($48,913, a difference of 0.16%), and Immigrants from Ethiopia ($48,924, a difference of 0.18%).
DemographicsRating | RankMedian Earnings
Palestinians
98.0
/100
|
#108
Exceptional
$49,209
Syrians
97.1
/100
|
#109
Exceptional
$48,934
Immigrants | Ethiopia
97.1
/100
|
#110
Exceptional
$48,924
Immigrants | Zimbabwe
97.0
/100
|
#111
Exceptional
$48,913
Northern Europeans
96.9
/100
|
#112
Exceptional
$48,887
Immigrants | Kuwait
96.8
/100
|
#113
Exceptional
$48,861
Moroccans
96.7
/100
|
#114
Exceptional
$48,838
Chinese
96.7
/100
|
#115
Exceptional
$48,836
Koreans
96.2
/100
|
#116
Exceptional
$48,727
Serbians
95.9
/100
|
#117
Exceptional
$48,677
Immigrants | Jordan
95.9
/100
|
#118
Exceptional
$48,673
Poles
95.8
/100
|
#119
Exceptional
$48,659
Carpatho Rusyns
95.5
/100
|
#120
Exceptional
$48,617
Arabs
95.4
/100
|
#121
Exceptional
$48,599
Chileans
94.8
/100
|
#122
Exceptional
$48,504

Demographics Similar to Immigrants from Russia by Median Earnings

In terms of median earnings, the demographic groups most similar to Immigrants from Russia are Immigrants from France ($53,490, a difference of 0.060%), Cambodian ($53,386, a difference of 0.13%), Russian ($53,334, a difference of 0.23%), Immigrants from Asia ($53,310, a difference of 0.28%), and Immigrants from Greece ($53,282, a difference of 0.33%).
DemographicsRating | RankMedian Earnings
Immigrants | Korea
100.0
/100
|
#22
Exceptional
$54,530
Immigrants | Sweden
100.0
/100
|
#23
Exceptional
$54,478
Soviet Union
100.0
/100
|
#24
Exceptional
$54,290
Turks
100.0
/100
|
#25
Exceptional
$53,919
Immigrants | Northern Europe
100.0
/100
|
#26
Exceptional
$53,872
Asians
100.0
/100
|
#27
Exceptional
$53,690
Immigrants | France
100.0
/100
|
#28
Exceptional
$53,490
Immigrants | Russia
100.0
/100
|
#29
Exceptional
$53,457
Cambodians
100.0
/100
|
#30
Exceptional
$53,386
Russians
100.0
/100
|
#31
Exceptional
$53,334
Immigrants | Asia
100.0
/100
|
#32
Exceptional
$53,310
Immigrants | Greece
100.0
/100
|
#33
Exceptional
$53,282
Immigrants | Sri Lanka
100.0
/100
|
#34
Exceptional
$53,268
Immigrants | Switzerland
100.0
/100
|
#35
Exceptional
$53,211
Immigrants | Denmark
100.0
/100
|
#36
Exceptional
$53,186