Slavic vs Immigrants from Nicaragua Median Earnings
COMPARE
Slavic
Immigrants from Nicaragua
Median Earnings
Median Earnings Comparison
Slavs
Immigrants from Nicaragua
$47,470
MEDIAN EARNINGS
81.1/ 100
METRIC RATING
153rd/ 347
METRIC RANK
$41,737
MEDIAN EARNINGS
0.1/ 100
METRIC RATING
285th/ 347
METRIC RANK
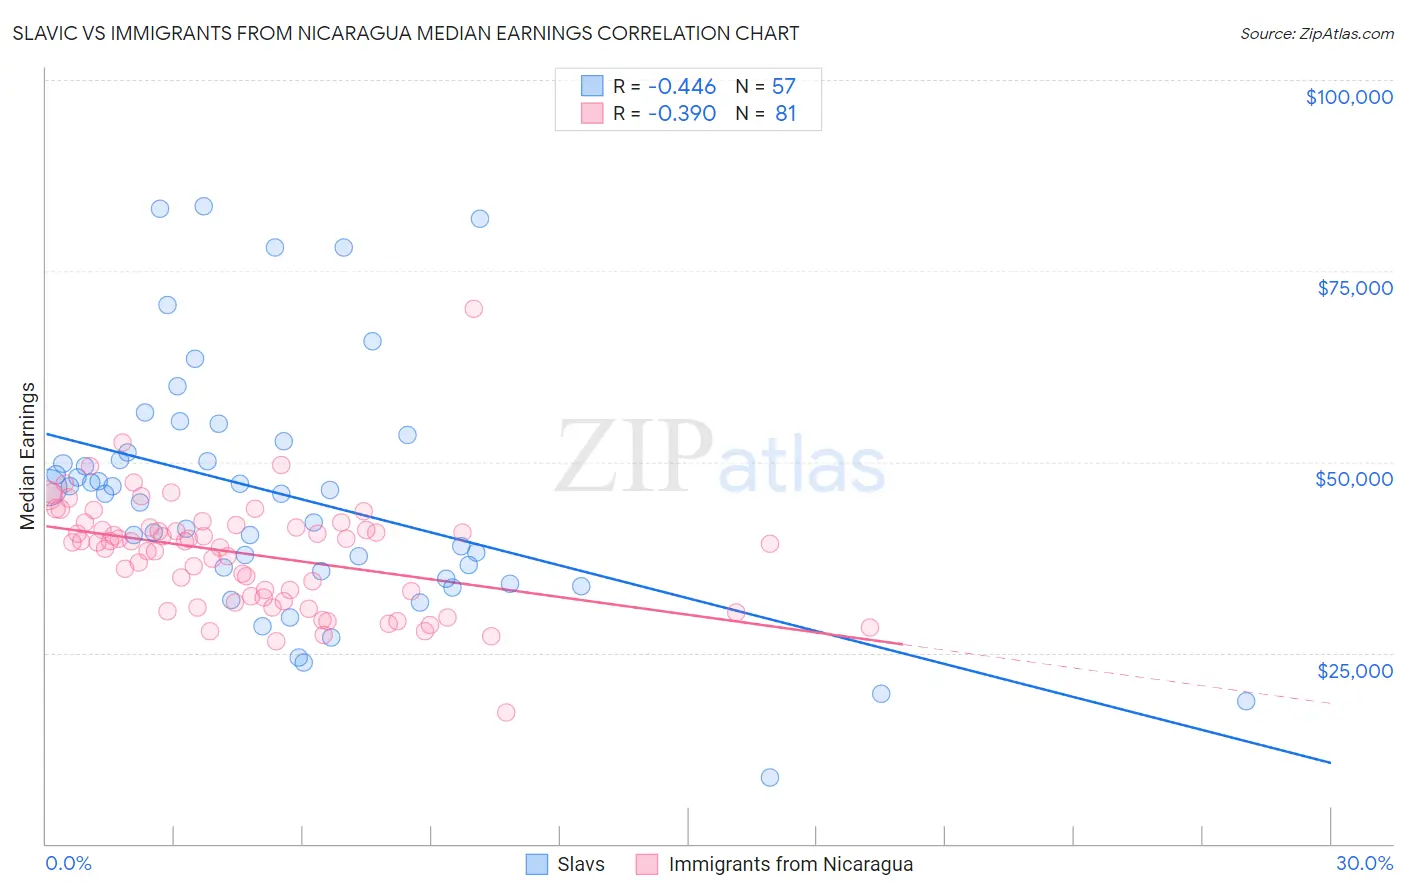
Slavic vs Immigrants from Nicaragua Median Earnings Correlation Chart
The statistical analysis conducted on geographies consisting of 270,868,378 people shows a moderate negative correlation between the proportion of Slavs and median earnings in the United States with a correlation coefficient (R) of -0.446 and weighted average of $47,470. Similarly, the statistical analysis conducted on geographies consisting of 236,337,785 people shows a mild negative correlation between the proportion of Immigrants from Nicaragua and median earnings in the United States with a correlation coefficient (R) of -0.390 and weighted average of $41,737, a difference of 13.7%.
Median Earnings Correlation Summary
| Measurement | Slavic | Immigrants from Nicaragua |
| Minimum | $8,672 | $17,262 |
| Maximum | $83,496 | $70,084 |
| Range | $74,824 | $52,822 |
| Mean | $45,520 | $37,945 |
| Median | $45,848 | $39,498 |
| Interquartile 25% (IQ1) | $35,213 | $31,989 |
| Interquartile 75% (IQ3) | $51,961 | $41,525 |
| Interquartile Range (IQR) | $16,749 | $9,536 |
| Standard Deviation (Sample) | $16,076 | $7,439 |
| Standard Deviation (Population) | $15,935 | $7,393 |
Similar Demographics by Median Earnings
Demographics Similar to Slavs by Median Earnings
In terms of median earnings, the demographic groups most similar to Slavs are Immigrants from Germany ($47,566, a difference of 0.20%), Immigrants from Oceania ($47,617, a difference of 0.31%), Peruvian ($47,628, a difference of 0.33%), Immigrants from Portugal ($47,304, a difference of 0.35%), and Luxembourger ($47,640, a difference of 0.36%).
| Demographics | Rating | Rank | Median Earnings |
| Immigrants | Chile | 85.5 /100 | #146 | Excellent $47,697 |
| Immigrants | South Eastern Asia | 85.0 /100 | #147 | Excellent $47,671 |
| Immigrants | Eritrea | 84.8 /100 | #148 | Excellent $47,657 |
| Luxembourgers | 84.5 /100 | #149 | Excellent $47,640 |
| Peruvians | 84.2 /100 | #150 | Excellent $47,628 |
| Immigrants | Oceania | 84.1 /100 | #151 | Excellent $47,617 |
| Immigrants | Germany | 83.1 /100 | #152 | Excellent $47,566 |
| Slavs | 81.1 /100 | #153 | Excellent $47,470 |
| Immigrants | Portugal | 77.3 /100 | #154 | Good $47,304 |
| Immigrants | Vietnam | 76.7 /100 | #155 | Good $47,282 |
| Irish | 76.6 /100 | #156 | Good $47,276 |
| Czechs | 75.1 /100 | #157 | Good $47,221 |
| Slovaks | 71.7 /100 | #158 | Good $47,095 |
| Immigrants | Peru | 69.6 /100 | #159 | Good $47,025 |
| Alsatians | 69.6 /100 | #160 | Good $47,023 |
Demographics Similar to Immigrants from Nicaragua by Median Earnings
In terms of median earnings, the demographic groups most similar to Immigrants from Nicaragua are Mexican American Indian ($41,719, a difference of 0.040%), Indonesian ($41,701, a difference of 0.090%), Blackfeet ($41,822, a difference of 0.20%), Dominican ($41,864, a difference of 0.31%), and Immigrants from Dominican Republic ($41,554, a difference of 0.44%).
| Demographics | Rating | Rank | Median Earnings |
| Cajuns | 0.3 /100 | #278 | Tragic $42,189 |
| Colville | 0.2 /100 | #279 | Tragic $42,151 |
| Hmong | 0.2 /100 | #280 | Tragic $42,111 |
| Marshallese | 0.2 /100 | #281 | Tragic $41,969 |
| Africans | 0.2 /100 | #282 | Tragic $41,955 |
| Dominicans | 0.2 /100 | #283 | Tragic $41,864 |
| Blackfeet | 0.2 /100 | #284 | Tragic $41,822 |
| Immigrants | Nicaragua | 0.1 /100 | #285 | Tragic $41,737 |
| Mexican American Indians | 0.1 /100 | #286 | Tragic $41,719 |
| Indonesians | 0.1 /100 | #287 | Tragic $41,701 |
| Immigrants | Dominican Republic | 0.1 /100 | #288 | Tragic $41,554 |
| Comanche | 0.1 /100 | #289 | Tragic $41,519 |
| Paiute | 0.1 /100 | #290 | Tragic $41,508 |
| Central American Indians | 0.1 /100 | #291 | Tragic $41,474 |
| U.S. Virgin Islanders | 0.1 /100 | #292 | Tragic $41,448 |