Pueblo vs Immigrants from Italy Median Household Income
COMPARE
Pueblo
Immigrants from Italy
Median Household Income
Median Household Income Comparison
Pueblo
Immigrants from Italy
$64,692
MEDIAN HOUSEHOLD INCOME
0.0/ 100
METRIC RATING
340th/ 347
METRIC RANK
$93,465
MEDIAN HOUSEHOLD INCOME
99.5/ 100
METRIC RATING
75th/ 347
METRIC RANK
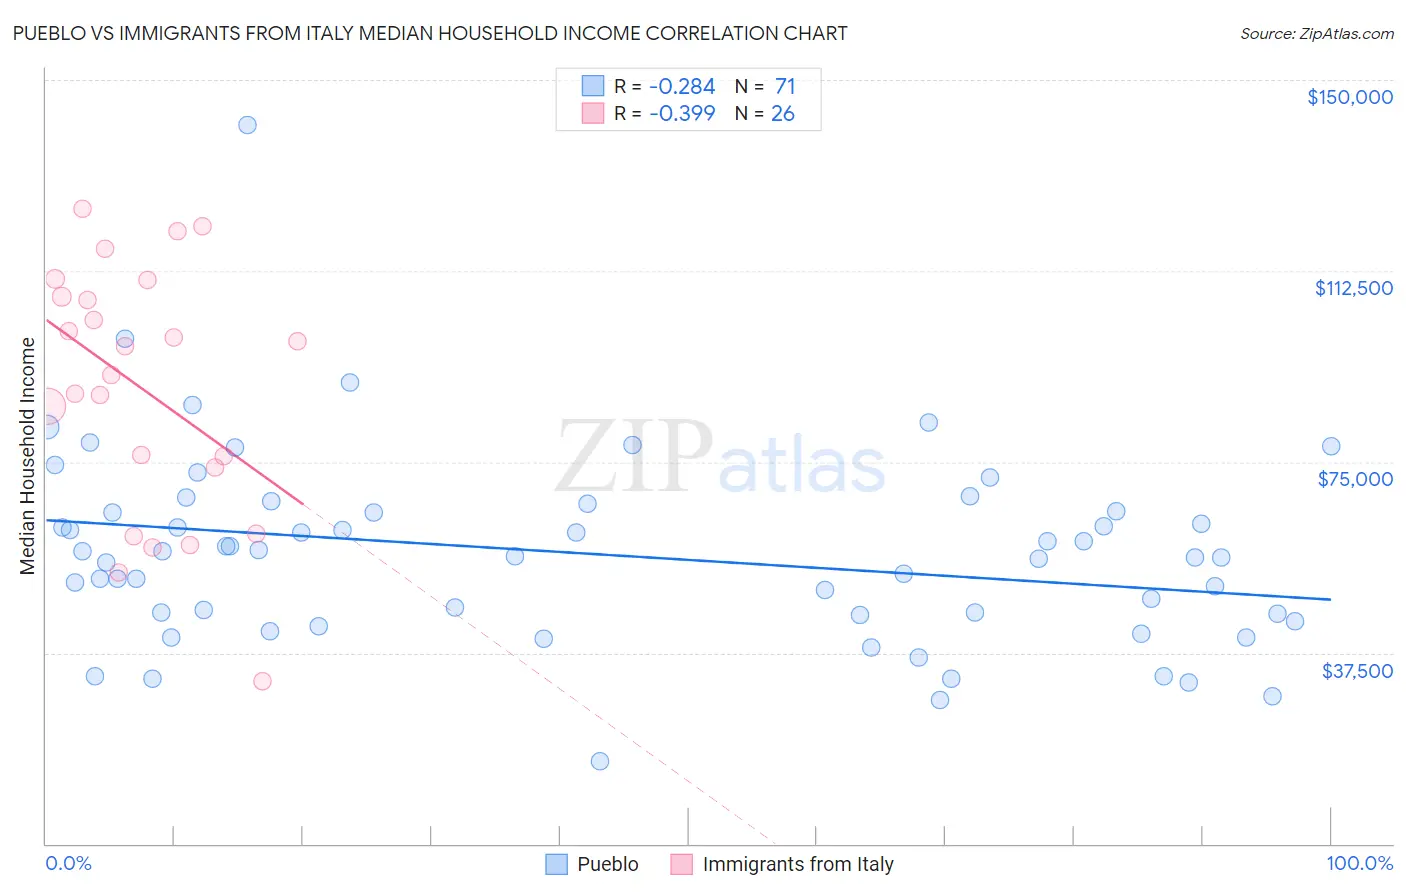
Pueblo vs Immigrants from Italy Median Household Income Correlation Chart
The statistical analysis conducted on geographies consisting of 120,058,820 people shows a weak negative correlation between the proportion of Pueblo and median household income in the United States with a correlation coefficient (R) of -0.284 and weighted average of $64,692. Similarly, the statistical analysis conducted on geographies consisting of 324,128,900 people shows a mild negative correlation between the proportion of Immigrants from Italy and median household income in the United States with a correlation coefficient (R) of -0.399 and weighted average of $93,465, a difference of 44.5%.
Median Household Income Correlation Summary
| Measurement | Pueblo | Immigrants from Italy |
| Minimum | $16,250 | $31,923 |
| Maximum | $141,139 | $124,607 |
| Range | $124,889 | $92,684 |
| Mean | $56,992 | $89,307 |
| Median | $56,397 | $94,900 |
| Interquartile 25% (IQ1) | $44,868 | $73,911 |
| Interquartile 75% (IQ3) | $65,216 | $107,408 |
| Interquartile Range (IQR) | $20,348 | $33,497 |
| Standard Deviation (Sample) | $19,041 | $24,372 |
| Standard Deviation (Population) | $18,906 | $23,899 |
Similar Demographics by Median Household Income
Demographics Similar to Pueblo by Median Household Income
In terms of median household income, the demographic groups most similar to Pueblo are Hopi ($65,043, a difference of 0.54%), Immigrants from Yemen ($65,194, a difference of 0.78%), Crow ($63,681, a difference of 1.6%), Kiowa ($65,914, a difference of 1.9%), and Pima ($63,262, a difference of 2.3%).
| Demographics | Rating | Rank | Median Household Income |
| Creek | 0.0 /100 | #333 | Tragic $67,715 |
| Blacks/African Americans | 0.0 /100 | #334 | Tragic $67,573 |
| Cheyenne | 0.0 /100 | #335 | Tragic $66,974 |
| Immigrants | Congo | 0.0 /100 | #336 | Tragic $66,768 |
| Kiowa | 0.0 /100 | #337 | Tragic $65,914 |
| Immigrants | Yemen | 0.0 /100 | #338 | Tragic $65,194 |
| Hopi | 0.0 /100 | #339 | Tragic $65,043 |
| Pueblo | 0.0 /100 | #340 | Tragic $64,692 |
| Crow | 0.0 /100 | #341 | Tragic $63,681 |
| Pima | 0.0 /100 | #342 | Tragic $63,262 |
| Houma | 0.0 /100 | #343 | Tragic $62,575 |
| Tohono O'odham | 0.0 /100 | #344 | Tragic $61,663 |
| Puerto Ricans | 0.0 /100 | #345 | Tragic $59,197 |
| Navajo | 0.0 /100 | #346 | Tragic $59,159 |
| Lumbee | 0.0 /100 | #347 | Tragic $54,644 |
Demographics Similar to Immigrants from Italy by Median Household Income
In terms of median household income, the demographic groups most similar to Immigrants from Italy are South African ($93,379, a difference of 0.090%), Immigrants from Afghanistan ($93,375, a difference of 0.10%), Immigrants from Latvia ($93,602, a difference of 0.15%), Immigrants from Egypt ($93,700, a difference of 0.25%), and Immigrants from Bulgaria ($93,148, a difference of 0.34%).
| Demographics | Rating | Rank | Median Household Income |
| Mongolians | 99.7 /100 | #68 | Exceptional $93,971 |
| Argentineans | 99.7 /100 | #69 | Exceptional $93,960 |
| Immigrants | Fiji | 99.7 /100 | #70 | Exceptional $93,933 |
| Immigrants | Philippines | 99.6 /100 | #71 | Exceptional $93,899 |
| Lithuanians | 99.6 /100 | #72 | Exceptional $93,852 |
| Immigrants | Egypt | 99.6 /100 | #73 | Exceptional $93,700 |
| Immigrants | Latvia | 99.6 /100 | #74 | Exceptional $93,602 |
| Immigrants | Italy | 99.5 /100 | #75 | Exceptional $93,465 |
| South Africans | 99.5 /100 | #76 | Exceptional $93,379 |
| Immigrants | Afghanistan | 99.5 /100 | #77 | Exceptional $93,375 |
| Immigrants | Bulgaria | 99.4 /100 | #78 | Exceptional $93,148 |
| Sri Lankans | 99.4 /100 | #79 | Exceptional $93,093 |
| Tongans | 99.4 /100 | #80 | Exceptional $93,076 |
| Immigrants | Eastern Europe | 99.4 /100 | #81 | Exceptional $93,051 |
| Immigrants | Spain | 99.3 /100 | #82 | Exceptional $92,732 |