Pueblo vs South American Median Household Income
COMPARE
Pueblo
South American
Median Household Income
Median Household Income Comparison
Pueblo
South Americans
$64,692
MEDIAN HOUSEHOLD INCOME
0.0/ 100
METRIC RATING
340th/ 347
METRIC RANK
$86,824
MEDIAN HOUSEHOLD INCOME
75.1/ 100
METRIC RATING
153rd/ 347
METRIC RANK
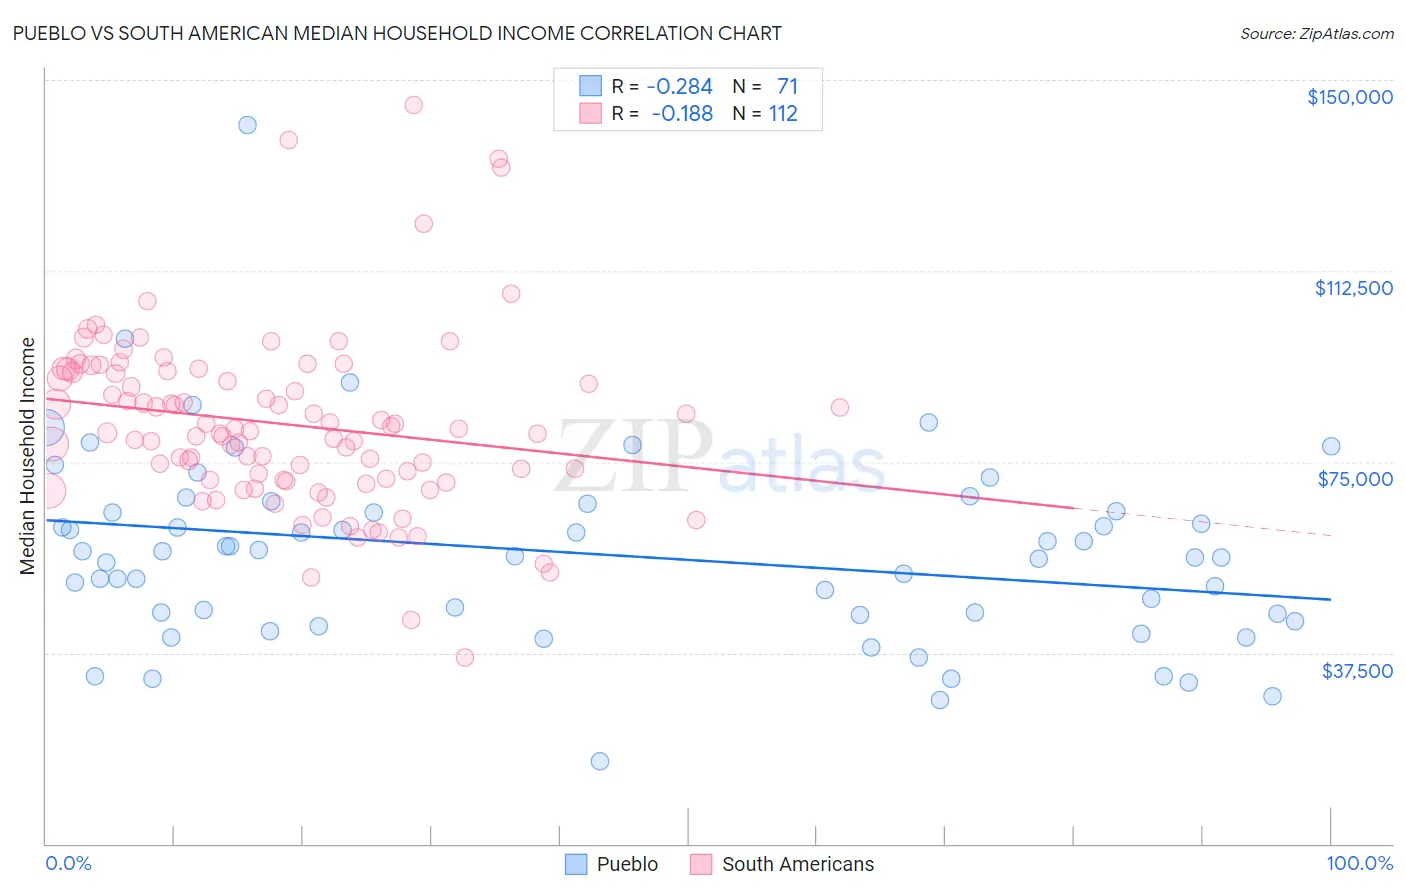
Pueblo vs South American Median Household Income Correlation Chart
The statistical analysis conducted on geographies consisting of 120,058,820 people shows a weak negative correlation between the proportion of Pueblo and median household income in the United States with a correlation coefficient (R) of -0.284 and weighted average of $64,692. Similarly, the statistical analysis conducted on geographies consisting of 493,431,068 people shows a poor negative correlation between the proportion of South Americans and median household income in the United States with a correlation coefficient (R) of -0.188 and weighted average of $86,824, a difference of 34.2%.
Median Household Income Correlation Summary
| Measurement | Pueblo | South American |
| Minimum | $16,250 | $36,563 |
| Maximum | $141,139 | $145,121 |
| Range | $124,889 | $108,558 |
| Mean | $56,992 | $82,451 |
| Median | $56,397 | $80,811 |
| Interquartile 25% (IQ1) | $44,868 | $71,448 |
| Interquartile 75% (IQ3) | $65,216 | $92,775 |
| Interquartile Range (IQR) | $20,348 | $21,327 |
| Standard Deviation (Sample) | $19,041 | $17,445 |
| Standard Deviation (Population) | $18,906 | $17,367 |
Similar Demographics by Median Household Income
Demographics Similar to Pueblo by Median Household Income
In terms of median household income, the demographic groups most similar to Pueblo are Hopi ($65,043, a difference of 0.54%), Immigrants from Yemen ($65,194, a difference of 0.78%), Crow ($63,681, a difference of 1.6%), Kiowa ($65,914, a difference of 1.9%), and Pima ($63,262, a difference of 2.3%).
| Demographics | Rating | Rank | Median Household Income |
| Creek | 0.0 /100 | #333 | Tragic $67,715 |
| Blacks/African Americans | 0.0 /100 | #334 | Tragic $67,573 |
| Cheyenne | 0.0 /100 | #335 | Tragic $66,974 |
| Immigrants | Congo | 0.0 /100 | #336 | Tragic $66,768 |
| Kiowa | 0.0 /100 | #337 | Tragic $65,914 |
| Immigrants | Yemen | 0.0 /100 | #338 | Tragic $65,194 |
| Hopi | 0.0 /100 | #339 | Tragic $65,043 |
| Pueblo | 0.0 /100 | #340 | Tragic $64,692 |
| Crow | 0.0 /100 | #341 | Tragic $63,681 |
| Pima | 0.0 /100 | #342 | Tragic $63,262 |
| Houma | 0.0 /100 | #343 | Tragic $62,575 |
| Tohono O'odham | 0.0 /100 | #344 | Tragic $61,663 |
| Puerto Ricans | 0.0 /100 | #345 | Tragic $59,197 |
| Navajo | 0.0 /100 | #346 | Tragic $59,159 |
| Lumbee | 0.0 /100 | #347 | Tragic $54,644 |
Demographics Similar to South Americans by Median Household Income
In terms of median household income, the demographic groups most similar to South Americans are Immigrants from Saudi Arabia ($86,875, a difference of 0.060%), Immigrants from Germany ($86,764, a difference of 0.070%), Hungarian ($86,920, a difference of 0.11%), Basque ($87,001, a difference of 0.20%), and Carpatho Rusyn ($86,635, a difference of 0.22%).
| Demographics | Rating | Rank | Median Household Income |
| Immigrants | Uganda | 82.8 /100 | #146 | Excellent $87,553 |
| South American Indians | 81.8 /100 | #147 | Excellent $87,446 |
| Costa Ricans | 80.0 /100 | #148 | Excellent $87,262 |
| Immigrants | Nepal | 77.7 /100 | #149 | Good $87,046 |
| Basques | 77.2 /100 | #150 | Good $87,001 |
| Hungarians | 76.3 /100 | #151 | Good $86,920 |
| Immigrants | Saudi Arabia | 75.8 /100 | #152 | Good $86,875 |
| South Americans | 75.1 /100 | #153 | Good $86,824 |
| Immigrants | Germany | 74.4 /100 | #154 | Good $86,764 |
| Carpatho Rusyns | 72.8 /100 | #155 | Good $86,635 |
| Immigrants | Albania | 71.5 /100 | #156 | Good $86,534 |
| Samoans | 71.0 /100 | #157 | Good $86,498 |
| Moroccans | 70.6 /100 | #158 | Good $86,468 |
| Immigrants | Uzbekistan | 70.1 /100 | #159 | Good $86,425 |
| Luxembourgers | 70.0 /100 | #160 | Good $86,418 |