Osage vs Nepalese Median Family Income
COMPARE
Osage
Nepalese
Median Family Income
Median Family Income Comparison
Osage
Nepalese
$91,926
MEDIAN FAMILY INCOME
0.4/ 100
METRIC RATING
258th/ 347
METRIC RANK
$94,153
MEDIAN FAMILY INCOME
1.3/ 100
METRIC RATING
238th/ 347
METRIC RANK
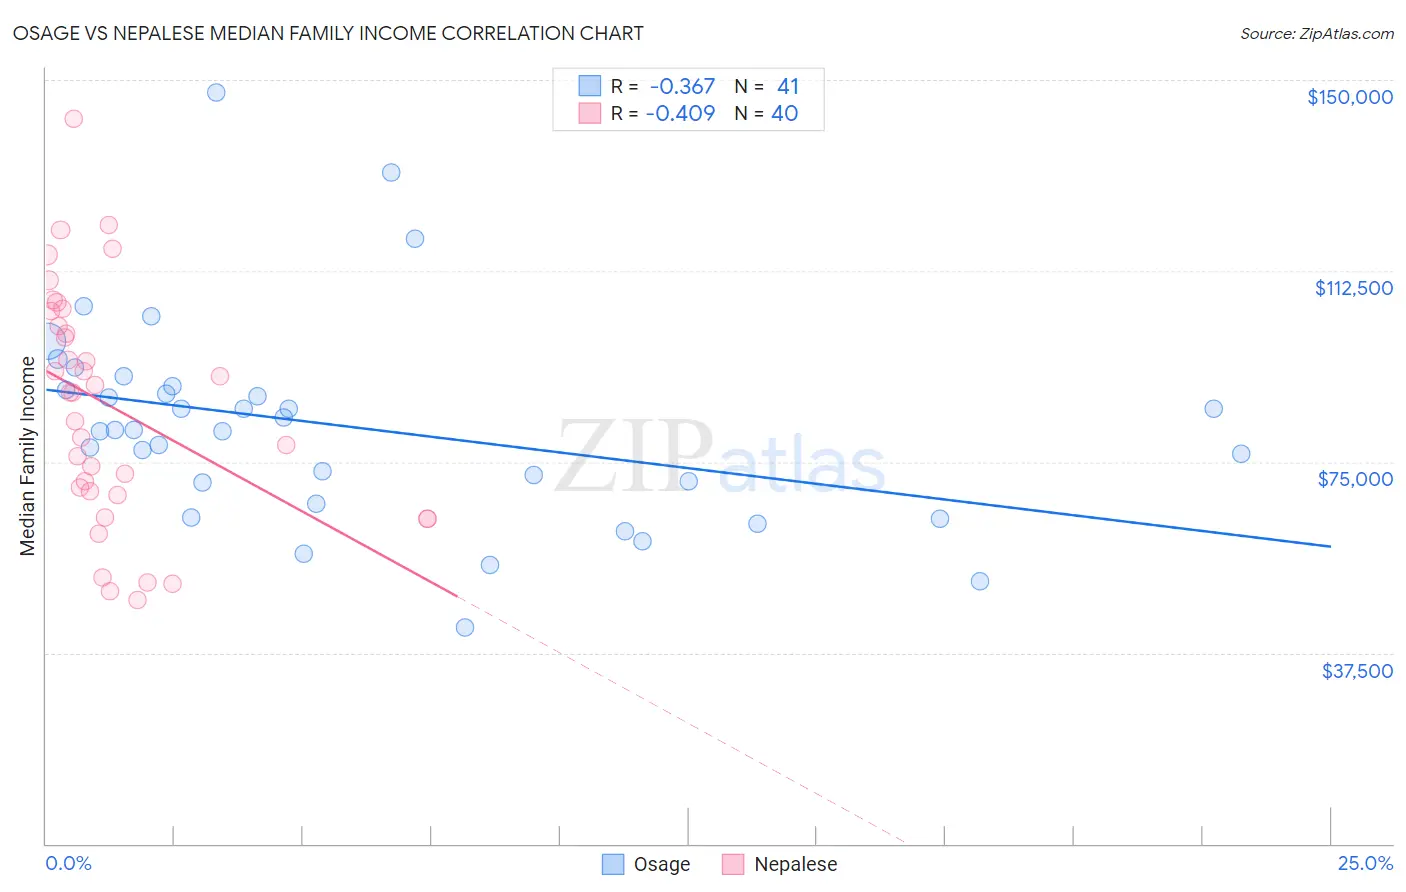
Osage vs Nepalese Median Family Income Correlation Chart
The statistical analysis conducted on geographies consisting of 91,794,477 people shows a mild negative correlation between the proportion of Osage and median family income in the United States with a correlation coefficient (R) of -0.367 and weighted average of $91,926. Similarly, the statistical analysis conducted on geographies consisting of 24,521,755 people shows a moderate negative correlation between the proportion of Nepalese and median family income in the United States with a correlation coefficient (R) of -0.409 and weighted average of $94,153, a difference of 2.4%.
Median Family Income Correlation Summary
| Measurement | Osage | Nepalese |
| Minimum | $42,500 | $47,952 |
| Maximum | $147,522 | $142,416 |
| Range | $105,022 | $94,464 |
| Mean | $81,978 | $85,857 |
| Median | $81,165 | $88,639 |
| Interquartile 25% (IQ1) | $68,927 | $68,953 |
| Interquartile 75% (IQ3) | $89,553 | $103,204 |
| Interquartile Range (IQR) | $20,626 | $34,251 |
| Standard Deviation (Sample) | $20,387 | $22,971 |
| Standard Deviation (Population) | $20,137 | $22,682 |
Demographics Similar to Osage and Nepalese by Median Family Income
In terms of median family income, the demographic groups most similar to Osage are American ($92,096, a difference of 0.19%), Nicaraguan ($92,231, a difference of 0.33%), Immigrants from Laos ($92,239, a difference of 0.34%), Immigrants from Barbados ($92,419, a difference of 0.54%), and Immigrants from Guyana ($92,513, a difference of 0.64%). Similarly, the demographic groups most similar to Nepalese are Salvadoran ($94,109, a difference of 0.050%), Somali ($94,085, a difference of 0.070%), Immigrants from Trinidad and Tobago ($93,988, a difference of 0.17%), Barbadian ($93,919, a difference of 0.25%), and German Russian ($93,858, a difference of 0.31%).
| Demographics | Rating | Rank | Median Family Income |
| Nepalese | 1.3 /100 | #238 | Tragic $94,153 |
| Salvadorans | 1.2 /100 | #239 | Tragic $94,109 |
| Somalis | 1.2 /100 | #240 | Tragic $94,085 |
| Immigrants | Trinidad and Tobago | 1.2 /100 | #241 | Tragic $93,988 |
| Barbadians | 1.1 /100 | #242 | Tragic $93,919 |
| German Russians | 1.1 /100 | #243 | Tragic $93,858 |
| Sub-Saharan Africans | 1.0 /100 | #244 | Tragic $93,748 |
| Immigrants | Middle Africa | 1.0 /100 | #245 | Tragic $93,593 |
| Guyanese | 0.9 /100 | #246 | Tragic $93,373 |
| Immigrants | Senegal | 0.7 /100 | #247 | Tragic $92,912 |
| French American Indians | 0.7 /100 | #248 | Tragic $92,872 |
| Immigrants | Ecuador | 0.7 /100 | #249 | Tragic $92,837 |
| West Indians | 0.6 /100 | #250 | Tragic $92,765 |
| Immigrants | Somalia | 0.6 /100 | #251 | Tragic $92,609 |
| Immigrants | El Salvador | 0.6 /100 | #252 | Tragic $92,545 |
| Immigrants | Guyana | 0.6 /100 | #253 | Tragic $92,513 |
| Immigrants | Barbados | 0.5 /100 | #254 | Tragic $92,419 |
| Immigrants | Laos | 0.5 /100 | #255 | Tragic $92,239 |
| Nicaraguans | 0.5 /100 | #256 | Tragic $92,231 |
| Americans | 0.4 /100 | #257 | Tragic $92,096 |
| Osage | 0.4 /100 | #258 | Tragic $91,926 |