Immigrants from Belgium vs Nepalese Median Family Income

COMPARE

Immigrants from Belgium
Race
Ancestry
AfghanAfricanAlaska NativeAlaskan AthabascanAlbanianAleutAlsatianAmericanApacheArabArapahoArgentineanArmenianAssyrian/Chaldean/SyriacAustralianAustrianBahamianBangladeshiBarbadianBasqueBelgianBelizeanBermudanBhutaneseBlackfeetBolivianBrazilianBritishBritish West IndianBulgarianBurmeseCajunCambodianCanadianCape VerdeanCarpatho RusynCelticCentral AmericanCentral American IndianCherokeeCheyenneChickasawChileanChineseChippewaChoctawColombianColvilleComancheCosta RicanCreeCreekCroatianCrowCubanCypriotCzechCzechoslovakianDanishDelawareDominicanDutchDutch West IndianEastern EuropeanEcuadorianEgyptianEnglishEstonianEthiopianEuropeanFijianFilipinoFinnishFrenchFrench American IndianFrench CanadianGermanGerman RussianGhanaianGreekGuamanian/ChamorroGuatemalanGuyaneseHaitianHmongHonduranHopiHoumaHungarianIcelanderIndian (Asian)IndonesianInupiatIranianIraqiIrishIroquoisIsraeliItalianJamaicanJapaneseJordanianKenyanKiowaKoreanLaotianLatvianLebaneseLiberianLithuanianLumbeeLuxembourgerMacedonianMalaysianMalteseMarshalleseMenomineeMexicanMexican American IndianMongolianMoroccanNative HawaiianNavajoNew ZealanderNicaraguanNigerianNorthern EuropeanNorwegianOkinawanOsageOttawaPaiutePakistaniPalestinianPanamanianParaguayanPennsylvania GermanPeruvianPimaPolishPortuguesePotawatomiPuebloPuerto RicanPuget Sound SalishRomanianRussianSalvadoranSamoanScandinavianScotch-IrishScottishSeminoleSenegaleseSerbianShoshoneSierra LeoneanSiouxSlavicSlovakSloveneSomaliSouth AfricanSouth AmericanSouth American IndianSoviet UnionSpaniardSpanishSpanish AmericanSpanish American IndianSri LankanSubsaharan AfricanSudaneseSwedishSwissSyrianTaiwaneseThaiTlingit-HaidaTohono O'OdhamTonganTrinidadian and TobagonianTsimshianTurkishU.S. Virgin IslanderUgandanUkrainianUruguayanUteVenezuelanVietnameseWelshWest IndianYakamaYaquiYugoslavianYumanYup'ikZimbabwean
Immigration
NonimmigrantsImmigrantsAfghanistanAfricaAlbaniaArgentinaArmeniaAsiaAustraliaAustriaBahamasBangladeshBarbadosBelarusBelgiumBelizeBoliviaBosnia and HerzegovinaBrazilBulgariaBurma/MyanmarCabo VerdeCambodiaCameroonCanadaCaribbeanCentral AmericaChileChinaColombiaCongoCosta RicaCroatiaCubaCzechoslovakiaDenmarkDominicaDominican RepublicEastern AfricaEastern AsiaEastern EuropeEcuadorEgyptEl SalvadorEnglandEritreaEthiopiaEuropeFijiFranceGermanyGhanaGreeceGrenadaGuatemalaGuyanaHaitiHondurasHong KongHungaryIndiaIndonesiaIranIraqIrelandIsraelItalyJamaicaJapanJordanKazakhstanKenyaKoreaKuwaitLaosLatin AmericaLatviaLebanonLiberiaLithuaniaMalaysiaMexicoMicronesiaMiddle AfricaMoldovaMoroccoNepalNetherlandsNicaraguaNigeriaNorth AmericaNorth MacedoniaNorthern AfricaNorthern EuropeNorwayOceaniaPakistanPanamaPeruPhilippinesPolandPortugalRomaniaRussiaSaudi ArabiaScotlandSenegalSerbiaSierra LeoneSingaporeSomaliaSouth AfricaSouth AmericaSouth Central AsiaSouth Eastern AsiaSouthern EuropeSpainSri LankaSt. Vincent and the GrenadinesSudanSwedenSwitzerlandSyriaTaiwanThailandTrinidad and TobagoTurkeyUgandaUkraineUruguayUzbekistanVenezuelaVietnamWest IndiesWestern AfricaWestern AsiaWestern EuropeYemenZaireZimbabweAzores
Nepalese
Race
Ancestry
AfghanAfricanAlaska NativeAlaskan AthabascanAlbanianAleutAlsatianAmericanApacheArabArapahoArgentineanArmenianAssyrian/Chaldean/SyriacAustralianAustrianBahamianBangladeshiBarbadianBasqueBelgianBelizeanBermudanBhutaneseBlackfeetBolivianBrazilianBritishBritish West IndianBulgarianBurmeseCajunCambodianCanadianCape VerdeanCarpatho RusynCelticCentral AmericanCentral American IndianCherokeeCheyenneChickasawChileanChineseChippewaChoctawColombianColvilleComancheCosta RicanCreeCreekCroatianCrowCubanCypriotCzechCzechoslovakianDanishDelawareDominicanDutchDutch West IndianEastern EuropeanEcuadorianEgyptianEnglishEstonianEthiopianEuropeanFijianFilipinoFinnishFrenchFrench American IndianFrench CanadianGermanGerman RussianGhanaianGreekGuamanian/ChamorroGuatemalanGuyaneseHaitianHmongHonduranHopiHoumaHungarianIcelanderIndian (Asian)IndonesianInupiatIranianIraqiIrishIroquoisIsraeliItalianJamaicanJapaneseJordanianKenyanKiowaKoreanLaotianLatvianLebaneseLiberianLithuanianLumbeeLuxembourgerMacedonianMalaysianMalteseMarshalleseMenomineeMexicanMexican American IndianMongolianMoroccanNative HawaiianNavajoNepaleseNew ZealanderNicaraguanNigerianNorthern EuropeanNorwegianOkinawanOsageOttawaPaiutePakistaniPalestinianPanamanianParaguayanPennsylvania GermanPeruvianPimaPolishPortuguesePotawatomiPuebloPuerto RicanPuget Sound SalishRomanianRussianSalvadoranSamoanScandinavianScotch-IrishScottishSeminoleSenegaleseSerbianShoshoneSierra LeoneanSiouxSlavicSlovakSloveneSomaliSouth AfricanSouth AmericanSouth American IndianSoviet UnionSpaniardSpanishSpanish AmericanSpanish American IndianSri LankanSubsaharan AfricanSudaneseSwedishSwissSyrianTaiwaneseThaiTlingit-HaidaTohono O'OdhamTonganTrinidadian and TobagonianTsimshianTurkishU.S. Virgin IslanderUgandanUkrainianUruguayanUteVenezuelanVietnameseWelshWest IndianYakamaYaquiYugoslavianYumanYup'ikZimbabwean
Immigration
NonimmigrantsImmigrantsAfghanistanAfricaAlbaniaArgentinaArmeniaAsiaAustraliaAustriaBahamasBangladeshBarbadosBelarusBelizeBoliviaBosnia and HerzegovinaBrazilBulgariaBurma/MyanmarCabo VerdeCambodiaCameroonCanadaCaribbeanCentral AmericaChileChinaColombiaCongoCosta RicaCroatiaCubaCzechoslovakiaDenmarkDominicaDominican RepublicEastern AfricaEastern AsiaEastern EuropeEcuadorEgyptEl SalvadorEnglandEritreaEthiopiaEuropeFijiFranceGermanyGhanaGreeceGrenadaGuatemalaGuyanaHaitiHondurasHong KongHungaryIndiaIndonesiaIranIraqIrelandIsraelItalyJamaicaJapanJordanKazakhstanKenyaKoreaKuwaitLaosLatin AmericaLatviaLebanonLiberiaLithuaniaMalaysiaMexicoMicronesiaMiddle AfricaMoldovaMoroccoNepalNetherlandsNicaraguaNigeriaNorth AmericaNorth MacedoniaNorthern AfricaNorthern EuropeNorwayOceaniaPakistanPanamaPeruPhilippinesPolandPortugalRomaniaRussiaSaudi ArabiaScotlandSenegalSerbiaSierra LeoneSingaporeSomaliaSouth AfricaSouth AmericaSouth Central AsiaSouth Eastern AsiaSouthern EuropeSpainSri LankaSt. Vincent and the GrenadinesSudanSwedenSwitzerlandSyriaTaiwanThailandTrinidad and TobagoTurkeyUgandaUkraineUruguayUzbekistanVenezuelaVietnamWest IndiesWestern AfricaWestern AsiaWestern EuropeYemenZaireZimbabweAzores
Median Family Income
Income
Poverty
Unemployment
Labor Participation
Family Structure
Vehicle Availability
Education Level
Disability

Median Family Income Comparison

Immigrants from Belgium

Nepalese

Exceptional
Tragic
$123,831
MEDIAN FAMILY INCOME
100.0/ 100
METRIC RATING
19th/ 347
METRIC RANK
$94,153
MEDIAN FAMILY INCOME
1.3/ 100
METRIC RATING
238th/ 347
METRIC RANK

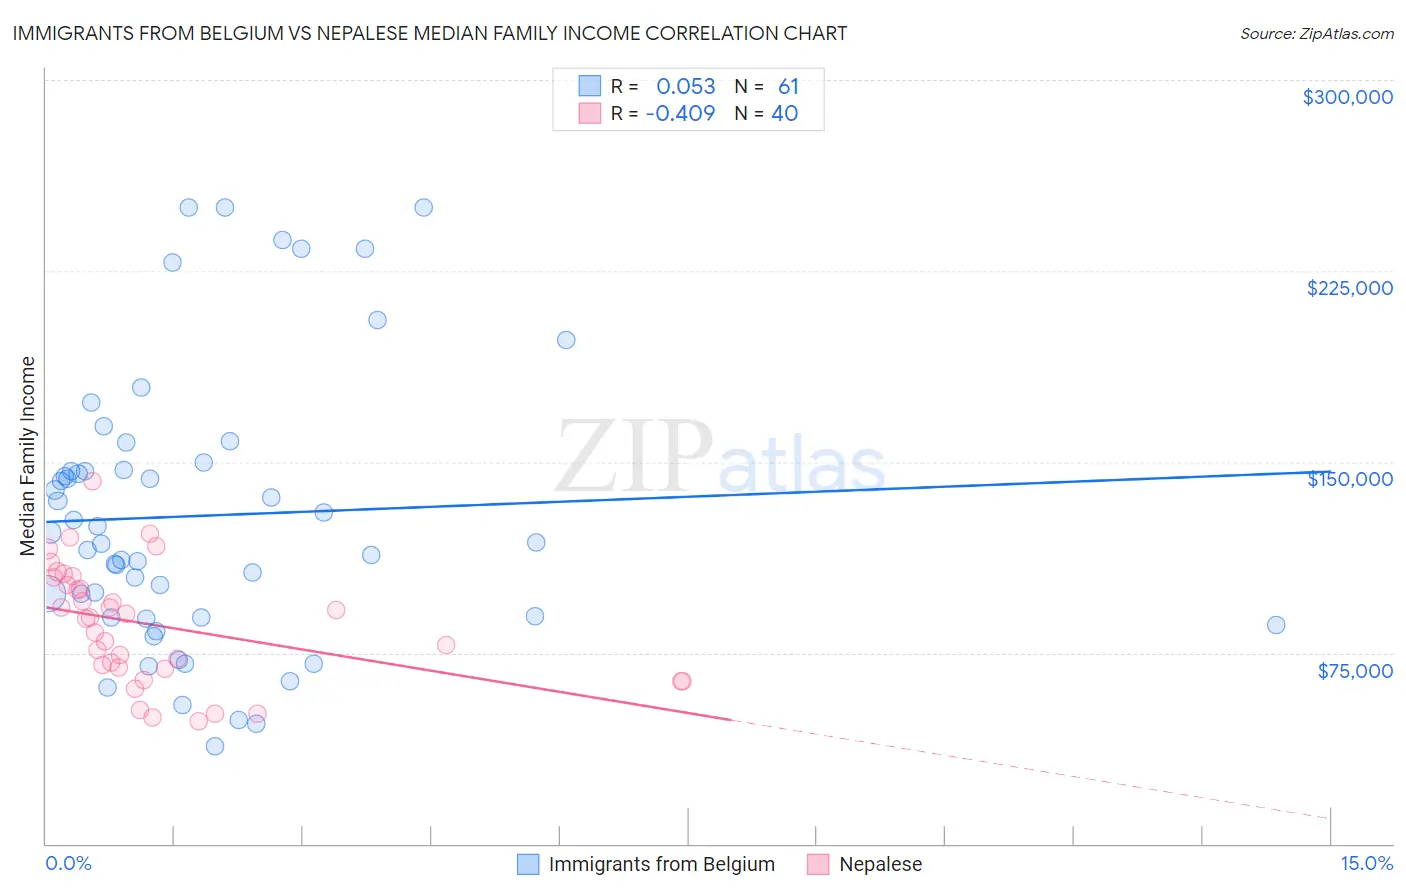
Immigrants from Belgium vs Nepalese Median Family Income Correlation Chart

The statistical analysis conducted on geographies consisting of 146,657,089 people shows a slight positive correlation between the proportion of Immigrants from Belgium and median family income in the United States with a correlation coefficient (R) of 0.053 and weighted average of $123,831. Similarly, the statistical analysis conducted on geographies consisting of 24,521,755 people shows a moderate negative correlation between the proportion of Nepalese and median family income in the United States with a correlation coefficient (R) of -0.409 and weighted average of $94,153, a difference of 31.5%.
Immigrants from Belgium vs Nepalese Median Family Income

Median Family Income Correlation Summary

MeasurementImmigrants from BelgiumNepalese
Minimum$38,056$47,952
Maximum$250,001$142,416
Range$211,945$94,464
Mean$128,845$85,857
Median$118,563$88,639
Interquartile 25% (IQ1)$88,684$68,953
Interquartile 75% (IQ3)$148,325$103,204
Interquartile Range (IQR)$59,642$34,251
Standard Deviation (Sample)$54,287$22,971
Standard Deviation (Population)$53,840$22,682

Similar Demographics by Median Family Income

Demographics Similar to Immigrants from Belgium by Median Family Income

In terms of median family income, the demographic groups most similar to Immigrants from Belgium are Burmese ($123,369, a difference of 0.37%), Immigrants from Korea ($122,800, a difference of 0.84%), Immigrants from Sweden ($122,765, a difference of 0.87%), Immigrants from Japan ($122,764, a difference of 0.87%), and Immigrants from Eastern Asia ($125,150, a difference of 1.1%).
DemographicsRating | RankMedian Family Income
Cypriots
100.0
/100
|
#12
Exceptional
$127,064
Immigrants | Australia
100.0
/100
|
#13
Exceptional
$126,620
Immigrants | South Central Asia
100.0
/100
|
#14
Exceptional
$125,956
Eastern Europeans
100.0
/100
|
#15
Exceptional
$125,546
Immigrants | China
100.0
/100
|
#16
Exceptional
$125,540
Indians (Asian)
100.0
/100
|
#17
Exceptional
$125,312
Immigrants | Eastern Asia
100.0
/100
|
#18
Exceptional
$125,150
Immigrants | Belgium
100.0
/100
|
#19
Exceptional
$123,831
Burmese
100.0
/100
|
#20
Exceptional
$123,369
Immigrants | Korea
100.0
/100
|
#21
Exceptional
$122,800
Immigrants | Sweden
100.0
/100
|
#22
Exceptional
$122,765
Immigrants | Japan
100.0
/100
|
#23
Exceptional
$122,764
Immigrants | Northern Europe
100.0
/100
|
#24
Exceptional
$121,840
Turks
100.0
/100
|
#25
Exceptional
$121,202
Immigrants | Switzerland
100.0
/100
|
#26
Exceptional
$120,726

Demographics Similar to Nepalese by Median Family Income

In terms of median family income, the demographic groups most similar to Nepalese are Salvadoran ($94,109, a difference of 0.050%), Somali ($94,085, a difference of 0.070%), Immigrants from Trinidad and Tobago ($93,988, a difference of 0.17%), Barbadian ($93,919, a difference of 0.25%), and Alaskan Athabascan ($94,429, a difference of 0.29%).
DemographicsRating | RankMedian Family Income
Ecuadorians
2.1
/100
|
#231
Tragic
$95,114
Immigrants | Venezuela
1.9
/100
|
#232
Tragic
$94,904
Immigrants | Bangladesh
1.6
/100
|
#233
Tragic
$94,665
Immigrants | Western Africa
1.6
/100
|
#234
Tragic
$94,638
Immigrants | Burma/Myanmar
1.5
/100
|
#235
Tragic
$94,472
Trinidadians and Tobagonians
1.5
/100
|
#236
Tragic
$94,466
Alaskan Athabascans
1.5
/100
|
#237
Tragic
$94,429
Nepalese
1.3
/100
|
#238
Tragic
$94,153
Salvadorans
1.2
/100
|
#239
Tragic
$94,109
Somalis
1.2
/100
|
#240
Tragic
$94,085
Immigrants | Trinidad and Tobago
1.2
/100
|
#241
Tragic
$93,988
Barbadians
1.1
/100
|
#242
Tragic
$93,919
German Russians
1.1
/100
|
#243
Tragic
$93,858
Sub-Saharan Africans
1.0
/100
|
#244
Tragic
$93,748
Immigrants | Middle Africa
1.0
/100
|
#245
Tragic
$93,593