Nepalese vs Immigrants Median Family Income
COMPARE
Nepalese
Immigrants
Median Family Income
Median Family Income Comparison
Nepalese
Immigrants
$94,153
MEDIAN FAMILY INCOME
1.3/ 100
METRIC RATING
238th/ 347
METRIC RANK
$100,962
MEDIAN FAMILY INCOME
29.4/ 100
METRIC RATING
190th/ 347
METRIC RANK
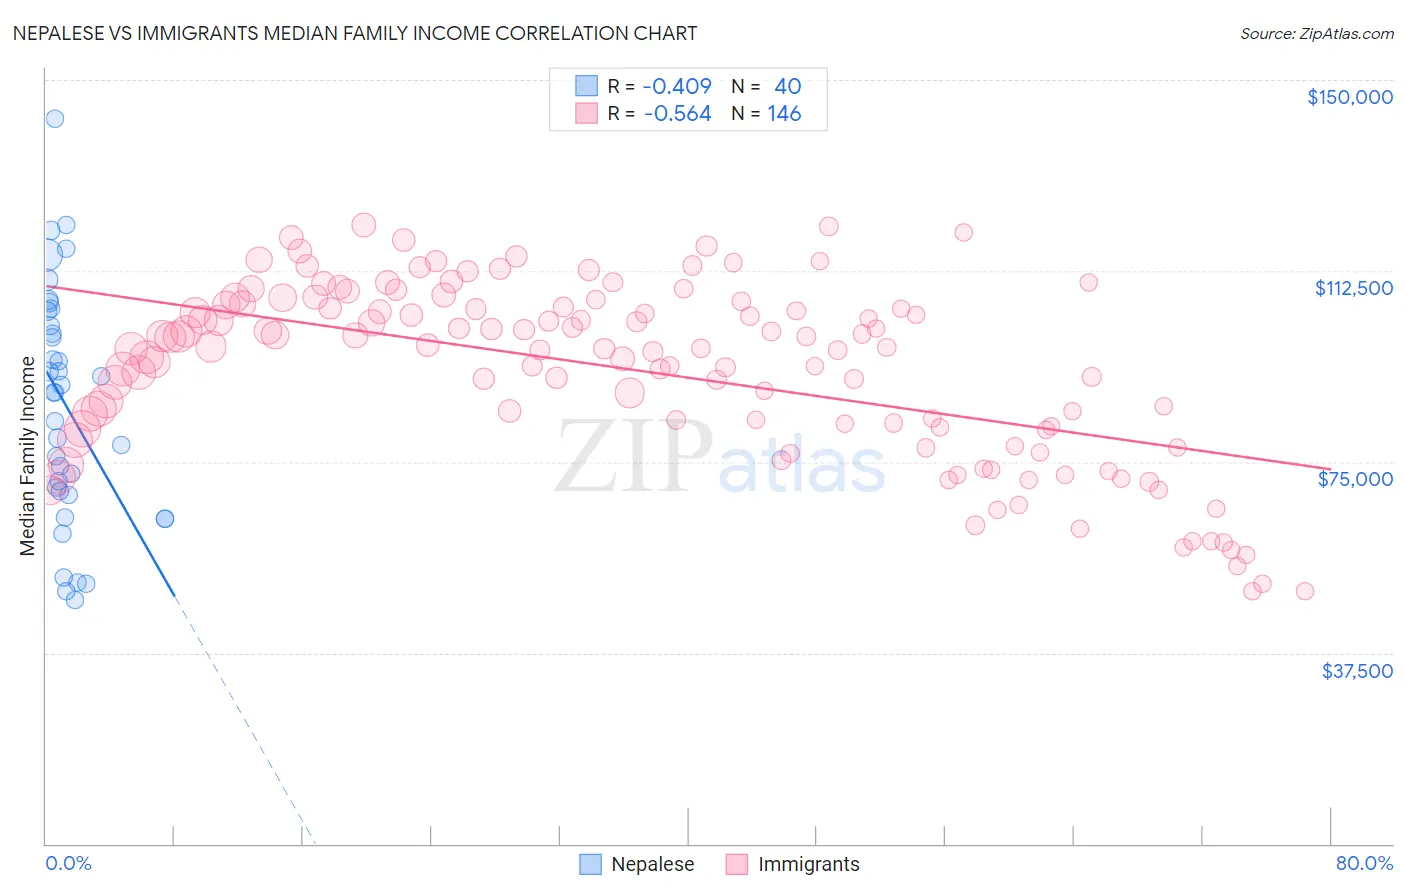
Nepalese vs Immigrants Median Family Income Correlation Chart
The statistical analysis conducted on geographies consisting of 24,521,755 people shows a moderate negative correlation between the proportion of Nepalese and median family income in the United States with a correlation coefficient (R) of -0.409 and weighted average of $94,153. Similarly, the statistical analysis conducted on geographies consisting of 575,657,782 people shows a substantial negative correlation between the proportion of Immigrants and median family income in the United States with a correlation coefficient (R) of -0.564 and weighted average of $100,962, a difference of 7.2%.
Median Family Income Correlation Summary
| Measurement | Nepalese | Immigrants |
| Minimum | $47,952 | $49,547 |
| Maximum | $142,416 | $121,425 |
| Range | $94,464 | $71,878 |
| Mean | $85,857 | $92,890 |
| Median | $88,639 | $97,277 |
| Interquartile 25% (IQ1) | $68,953 | $81,623 |
| Interquartile 75% (IQ3) | $103,204 | $105,367 |
| Interquartile Range (IQR) | $34,251 | $23,744 |
| Standard Deviation (Sample) | $22,971 | $17,448 |
| Standard Deviation (Population) | $22,682 | $17,388 |
Similar Demographics by Median Family Income
Demographics Similar to Nepalese by Median Family Income
In terms of median family income, the demographic groups most similar to Nepalese are Salvadoran ($94,109, a difference of 0.050%), Somali ($94,085, a difference of 0.070%), Immigrants from Trinidad and Tobago ($93,988, a difference of 0.17%), Barbadian ($93,919, a difference of 0.25%), and Alaskan Athabascan ($94,429, a difference of 0.29%).
| Demographics | Rating | Rank | Median Family Income |
| Ecuadorians | 2.1 /100 | #231 | Tragic $95,114 |
| Immigrants | Venezuela | 1.9 /100 | #232 | Tragic $94,904 |
| Immigrants | Bangladesh | 1.6 /100 | #233 | Tragic $94,665 |
| Immigrants | Western Africa | 1.6 /100 | #234 | Tragic $94,638 |
| Immigrants | Burma/Myanmar | 1.5 /100 | #235 | Tragic $94,472 |
| Trinidadians and Tobagonians | 1.5 /100 | #236 | Tragic $94,466 |
| Alaskan Athabascans | 1.5 /100 | #237 | Tragic $94,429 |
| Nepalese | 1.3 /100 | #238 | Tragic $94,153 |
| Salvadorans | 1.2 /100 | #239 | Tragic $94,109 |
| Somalis | 1.2 /100 | #240 | Tragic $94,085 |
| Immigrants | Trinidad and Tobago | 1.2 /100 | #241 | Tragic $93,988 |
| Barbadians | 1.1 /100 | #242 | Tragic $93,919 |
| German Russians | 1.1 /100 | #243 | Tragic $93,858 |
| Sub-Saharan Africans | 1.0 /100 | #244 | Tragic $93,748 |
| Immigrants | Middle Africa | 1.0 /100 | #245 | Tragic $93,593 |
Demographics Similar to Immigrants by Median Family Income
In terms of median family income, the demographic groups most similar to Immigrants are Immigrants from Portugal ($100,984, a difference of 0.020%), Guamanian/Chamorro ($101,061, a difference of 0.10%), Tlingit-Haida ($101,092, a difference of 0.13%), Celtic ($101,139, a difference of 0.18%), and Colombian ($100,750, a difference of 0.21%).
| Demographics | Rating | Rank | Median Family Income |
| Kenyans | 34.5 /100 | #183 | Fair $101,417 |
| Immigrants | Costa Rica | 33.7 /100 | #184 | Fair $101,354 |
| Dutch | 31.9 /100 | #185 | Fair $101,192 |
| Celtics | 31.3 /100 | #186 | Fair $101,139 |
| Tlingit-Haida | 30.8 /100 | #187 | Fair $101,092 |
| Guamanians/Chamorros | 30.5 /100 | #188 | Fair $101,061 |
| Immigrants | Portugal | 29.6 /100 | #189 | Fair $100,984 |
| Immigrants | Immigrants | 29.4 /100 | #190 | Fair $100,962 |
| Colombians | 27.2 /100 | #191 | Fair $100,750 |
| Immigrants | Kenya | 26.5 /100 | #192 | Fair $100,679 |
| Iraqis | 26.3 /100 | #193 | Fair $100,658 |
| Uruguayans | 26.3 /100 | #194 | Fair $100,656 |
| Immigrants | South America | 23.9 /100 | #195 | Fair $100,414 |
| Samoans | 23.3 /100 | #196 | Fair $100,344 |
| Immigrants | Cameroon | 22.8 /100 | #197 | Fair $100,289 |