Kenyan vs Hawaiian Median Family Income
COMPARE
Kenyan
Hawaiian
Median Family Income
Median Family Income Comparison
Kenyans
Hawaiians
$101,417
MEDIAN FAMILY INCOME
34.5/ 100
METRIC RATING
183rd/ 347
METRIC RANK
$98,869
MEDIAN FAMILY INCOME
12.5/ 100
METRIC RATING
205th/ 347
METRIC RANK
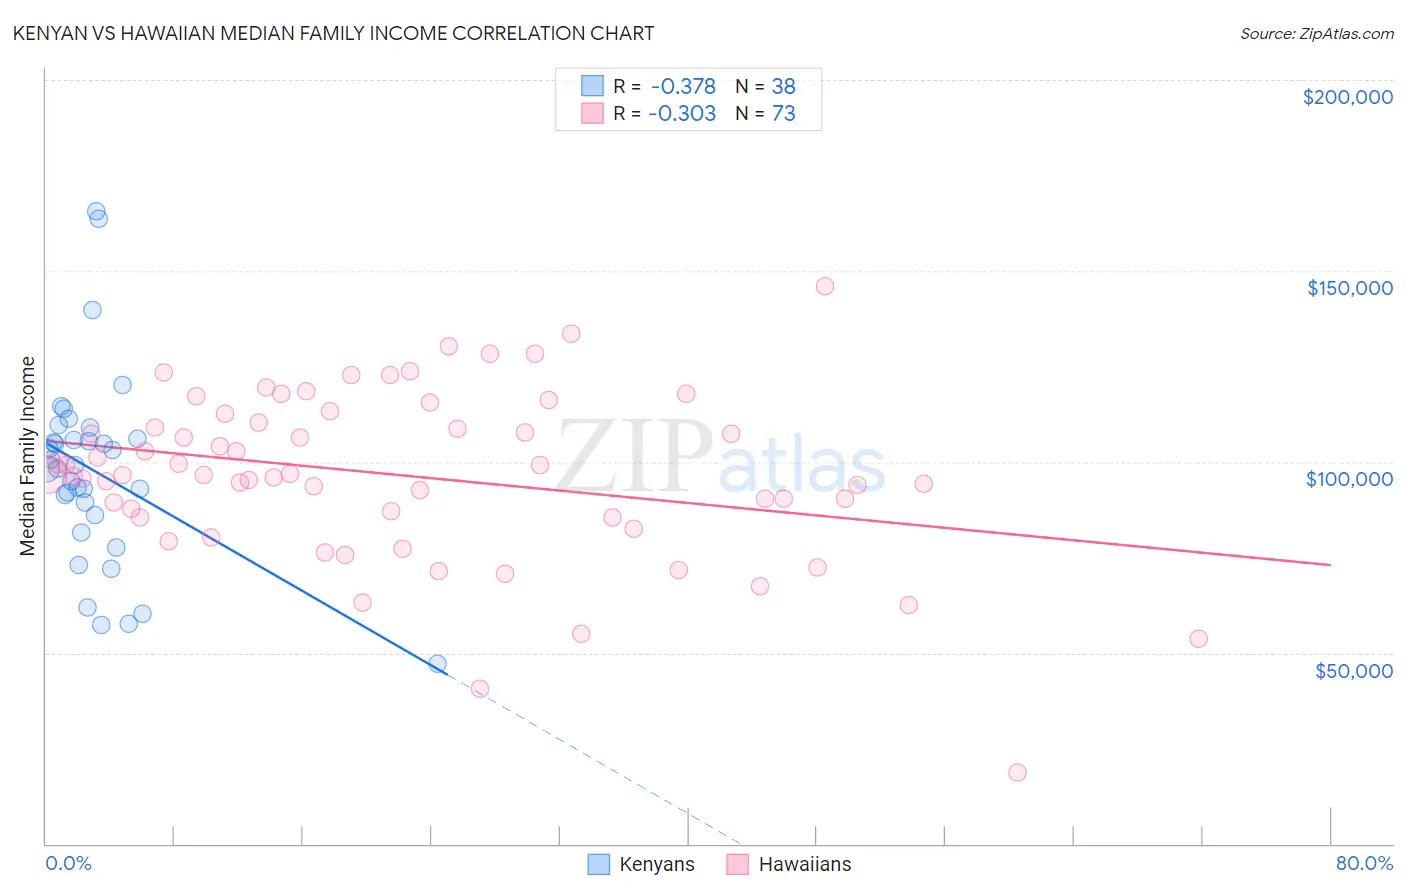
Kenyan vs Hawaiian Median Family Income Correlation Chart
The statistical analysis conducted on geographies consisting of 168,122,613 people shows a mild negative correlation between the proportion of Kenyans and median family income in the United States with a correlation coefficient (R) of -0.378 and weighted average of $101,417. Similarly, the statistical analysis conducted on geographies consisting of 327,312,132 people shows a mild negative correlation between the proportion of Hawaiians and median family income in the United States with a correlation coefficient (R) of -0.303 and weighted average of $98,869, a difference of 2.6%.
Median Family Income Correlation Summary
| Measurement | Kenyan | Hawaiian |
| Minimum | $47,000 | $18,796 |
| Maximum | $165,640 | $146,000 |
| Range | $118,640 | $127,204 |
| Mean | $97,471 | $96,414 |
| Median | $98,633 | $96,571 |
| Interquartile 25% (IQ1) | $86,023 | $85,564 |
| Interquartile 75% (IQ3) | $106,111 | $111,384 |
| Interquartile Range (IQR) | $20,088 | $25,820 |
| Standard Deviation (Sample) | $25,158 | $22,234 |
| Standard Deviation (Population) | $24,824 | $22,081 |
Similar Demographics by Median Family Income
Demographics Similar to Kenyans by Median Family Income
In terms of median family income, the demographic groups most similar to Kenyans are Immigrants from Costa Rica ($101,354, a difference of 0.060%), Tsimshian ($101,543, a difference of 0.12%), Spaniard ($101,617, a difference of 0.20%), French Canadian ($101,634, a difference of 0.21%), and Dutch ($101,192, a difference of 0.22%).
| Demographics | Rating | Rank | Median Family Income |
| French | 46.1 /100 | #176 | Average $102,368 |
| Germans | 44.6 /100 | #177 | Average $102,254 |
| Welsh | 43.3 /100 | #178 | Average $102,151 |
| South Americans | 39.7 /100 | #179 | Fair $101,856 |
| French Canadians | 37.0 /100 | #180 | Fair $101,634 |
| Spaniards | 36.8 /100 | #181 | Fair $101,617 |
| Tsimshian | 35.9 /100 | #182 | Fair $101,543 |
| Kenyans | 34.5 /100 | #183 | Fair $101,417 |
| Immigrants | Costa Rica | 33.7 /100 | #184 | Fair $101,354 |
| Dutch | 31.9 /100 | #185 | Fair $101,192 |
| Celtics | 31.3 /100 | #186 | Fair $101,139 |
| Tlingit-Haida | 30.8 /100 | #187 | Fair $101,092 |
| Guamanians/Chamorros | 30.5 /100 | #188 | Fair $101,061 |
| Immigrants | Portugal | 29.6 /100 | #189 | Fair $100,984 |
| Immigrants | Immigrants | 29.4 /100 | #190 | Fair $100,962 |
Demographics Similar to Hawaiians by Median Family Income
In terms of median family income, the demographic groups most similar to Hawaiians are Ghanaian ($98,877, a difference of 0.010%), Immigrants from Iraq ($98,786, a difference of 0.080%), Aleut ($98,702, a difference of 0.17%), Immigrants from Uruguay ($98,205, a difference of 0.68%), and Scotch-Irish ($99,591, a difference of 0.73%).
| Demographics | Rating | Rank | Median Family Income |
| Immigrants | Africa | 22.5 /100 | #198 | Fair $100,256 |
| Yugoslavians | 21.3 /100 | #199 | Fair $100,119 |
| Spanish | 20.1 /100 | #200 | Fair $99,977 |
| Immigrants | Thailand | 19.0 /100 | #201 | Poor $99,840 |
| Whites/Caucasians | 18.7 /100 | #202 | Poor $99,800 |
| Scotch-Irish | 17.1 /100 | #203 | Poor $99,591 |
| Ghanaians | 12.6 /100 | #204 | Poor $98,877 |
| Hawaiians | 12.5 /100 | #205 | Poor $98,869 |
| Immigrants | Iraq | 12.1 /100 | #206 | Poor $98,786 |
| Aleuts | 11.6 /100 | #207 | Poor $98,702 |
| Immigrants | Uruguay | 9.2 /100 | #208 | Tragic $98,205 |
| Immigrants | Colombia | 8.7 /100 | #209 | Tragic $98,067 |
| Puget Sound Salish | 8.2 /100 | #210 | Tragic $97,958 |
| Immigrants | Sudan | 7.4 /100 | #211 | Tragic $97,737 |
| Panamanians | 7.2 /100 | #212 | Tragic $97,683 |