Kenyan vs Maltese Median Family Income

COMPARE

Kenyan
Race
Ancestry
AfghanAfricanAlaska NativeAlaskan AthabascanAlbanianAleutAlsatianAmericanApacheArabArapahoArgentineanArmenianAssyrian/Chaldean/SyriacAustralianAustrianBahamianBangladeshiBarbadianBasqueBelgianBelizeanBermudanBhutaneseBlackfeetBolivianBrazilianBritishBritish West IndianBulgarianBurmeseCajunCambodianCanadianCape VerdeanCarpatho RusynCelticCentral AmericanCentral American IndianCherokeeCheyenneChickasawChileanChineseChippewaChoctawColombianColvilleComancheCosta RicanCreeCreekCroatianCrowCubanCypriotCzechCzechoslovakianDanishDelawareDominicanDutchDutch West IndianEastern EuropeanEcuadorianEgyptianEnglishEstonianEthiopianEuropeanFijianFilipinoFinnishFrenchFrench American IndianFrench CanadianGermanGerman RussianGhanaianGreekGuamanian/ChamorroGuatemalanGuyaneseHaitianHmongHonduranHopiHoumaHungarianIcelanderIndian (Asian)IndonesianInupiatIranianIraqiIrishIroquoisIsraeliItalianJamaicanJapaneseJordanianKenyanKiowaKoreanLaotianLatvianLebaneseLiberianLithuanianLumbeeLuxembourgerMacedonianMalaysianMarshalleseMenomineeMexicanMexican American IndianMongolianMoroccanNative HawaiianNavajoNepaleseNew ZealanderNicaraguanNigerianNorthern EuropeanNorwegianOkinawanOsageOttawaPaiutePakistaniPalestinianPanamanianParaguayanPennsylvania GermanPeruvianPimaPolishPortuguesePotawatomiPuebloPuerto RicanPuget Sound SalishRomanianRussianSalvadoranSamoanScandinavianScotch-IrishScottishSeminoleSenegaleseSerbianShoshoneSierra LeoneanSiouxSlavicSlovakSloveneSomaliSouth AfricanSouth AmericanSouth American IndianSoviet UnionSpaniardSpanishSpanish AmericanSpanish American IndianSri LankanSubsaharan AfricanSudaneseSwedishSwissSyrianTaiwaneseThaiTlingit-HaidaTohono O'OdhamTonganTrinidadian and TobagonianTsimshianTurkishU.S. Virgin IslanderUgandanUkrainianUruguayanUteVenezuelanVietnameseWelshWest IndianYakamaYaquiYugoslavianYumanYup'ikZimbabwean
Immigration
NonimmigrantsImmigrantsAfghanistanAfricaAlbaniaArgentinaArmeniaAsiaAustraliaAustriaBahamasBangladeshBarbadosBelarusBelgiumBelizeBoliviaBosnia and HerzegovinaBrazilBulgariaBurma/MyanmarCabo VerdeCambodiaCameroonCanadaCaribbeanCentral AmericaChileChinaColombiaCongoCosta RicaCroatiaCubaCzechoslovakiaDenmarkDominicaDominican RepublicEastern AfricaEastern AsiaEastern EuropeEcuadorEgyptEl SalvadorEnglandEritreaEthiopiaEuropeFijiFranceGermanyGhanaGreeceGrenadaGuatemalaGuyanaHaitiHondurasHong KongHungaryIndiaIndonesiaIranIraqIrelandIsraelItalyJamaicaJapanJordanKazakhstanKenyaKoreaKuwaitLaosLatin AmericaLatviaLebanonLiberiaLithuaniaMalaysiaMexicoMicronesiaMiddle AfricaMoldovaMoroccoNepalNetherlandsNicaraguaNigeriaNorth AmericaNorth MacedoniaNorthern AfricaNorthern EuropeNorwayOceaniaPakistanPanamaPeruPhilippinesPolandPortugalRomaniaRussiaSaudi ArabiaScotlandSenegalSerbiaSierra LeoneSingaporeSomaliaSouth AfricaSouth AmericaSouth Central AsiaSouth Eastern AsiaSouthern EuropeSpainSri LankaSt. Vincent and the GrenadinesSudanSwedenSwitzerlandSyriaTaiwanThailandTrinidad and TobagoTurkeyUgandaUkraineUruguayUzbekistanVenezuelaVietnamWest IndiesWestern AfricaWestern AsiaWestern EuropeYemenZaireZimbabweAzores
Maltese
Race
Ancestry
AfghanAfricanAlaska NativeAlaskan AthabascanAlbanianAleutAlsatianAmericanApacheArabArapahoArgentineanArmenianAssyrian/Chaldean/SyriacAustralianAustrianBahamianBangladeshiBarbadianBasqueBelgianBelizeanBermudanBhutaneseBlackfeetBolivianBrazilianBritishBritish West IndianBulgarianBurmeseCajunCambodianCanadianCape VerdeanCarpatho RusynCelticCentral AmericanCentral American IndianCherokeeCheyenneChickasawChileanChineseChippewaChoctawColombianColvilleComancheCosta RicanCreeCreekCroatianCrowCubanCypriotCzechCzechoslovakianDanishDelawareDominicanDutchDutch West IndianEastern EuropeanEcuadorianEgyptianEnglishEstonianEthiopianEuropeanFijianFilipinoFinnishFrenchFrench American IndianFrench CanadianGermanGerman RussianGhanaianGreekGuamanian/ChamorroGuatemalanGuyaneseHaitianHmongHonduranHopiHoumaHungarianIcelanderIndian (Asian)IndonesianInupiatIranianIraqiIrishIroquoisIsraeliItalianJamaicanJapaneseJordanianKiowaKoreanLaotianLatvianLebaneseLiberianLithuanianLumbeeLuxembourgerMacedonianMalaysianMalteseMarshalleseMenomineeMexicanMexican American IndianMongolianMoroccanNative HawaiianNavajoNepaleseNew ZealanderNicaraguanNigerianNorthern EuropeanNorwegianOkinawanOsageOttawaPaiutePakistaniPalestinianPanamanianParaguayanPennsylvania GermanPeruvianPimaPolishPortuguesePotawatomiPuebloPuerto RicanPuget Sound SalishRomanianRussianSalvadoranSamoanScandinavianScotch-IrishScottishSeminoleSenegaleseSerbianShoshoneSierra LeoneanSiouxSlavicSlovakSloveneSomaliSouth AfricanSouth AmericanSouth American IndianSoviet UnionSpaniardSpanishSpanish AmericanSpanish American IndianSri LankanSubsaharan AfricanSudaneseSwedishSwissSyrianTaiwaneseThaiTlingit-HaidaTohono O'OdhamTonganTrinidadian and TobagonianTsimshianTurkishU.S. Virgin IslanderUgandanUkrainianUruguayanUteVenezuelanVietnameseWelshWest IndianYakamaYaquiYugoslavianYumanYup'ikZimbabwean
Immigration
NonimmigrantsImmigrantsAfghanistanAfricaAlbaniaArgentinaArmeniaAsiaAustraliaAustriaBahamasBangladeshBarbadosBelarusBelgiumBelizeBoliviaBosnia and HerzegovinaBrazilBulgariaBurma/MyanmarCabo VerdeCambodiaCameroonCanadaCaribbeanCentral AmericaChileChinaColombiaCongoCosta RicaCroatiaCubaCzechoslovakiaDenmarkDominicaDominican RepublicEastern AfricaEastern AsiaEastern EuropeEcuadorEgyptEl SalvadorEnglandEritreaEthiopiaEuropeFijiFranceGermanyGhanaGreeceGrenadaGuatemalaGuyanaHaitiHondurasHong KongHungaryIndiaIndonesiaIranIraqIrelandIsraelItalyJamaicaJapanJordanKazakhstanKenyaKoreaKuwaitLaosLatin AmericaLatviaLebanonLiberiaLithuaniaMalaysiaMexicoMicronesiaMiddle AfricaMoldovaMoroccoNepalNetherlandsNicaraguaNigeriaNorth AmericaNorth MacedoniaNorthern AfricaNorthern EuropeNorwayOceaniaPakistanPanamaPeruPhilippinesPolandPortugalRomaniaRussiaSaudi ArabiaScotlandSenegalSerbiaSierra LeoneSingaporeSomaliaSouth AfricaSouth AmericaSouth Central AsiaSouth Eastern AsiaSouthern EuropeSpainSri LankaSt. Vincent and the GrenadinesSudanSwedenSwitzerlandSyriaTaiwanThailandTrinidad and TobagoTurkeyUgandaUkraineUruguayUzbekistanVenezuelaVietnamWest IndiesWestern AfricaWestern AsiaWestern EuropeYemenZaireZimbabweAzores
Median Family Income
Income
Poverty
Unemployment
Labor Participation
Family Structure
Vehicle Availability
Education Level
Disability

Median Family Income Comparison

Kenyans

Maltese

Fair
Exceptional
$101,417
MEDIAN FAMILY INCOME
34.5/ 100
METRIC RATING
183rd/ 347
METRIC RANK
$115,862
MEDIAN FAMILY INCOME
99.9/ 100
METRIC RATING
52nd/ 347
METRIC RANK

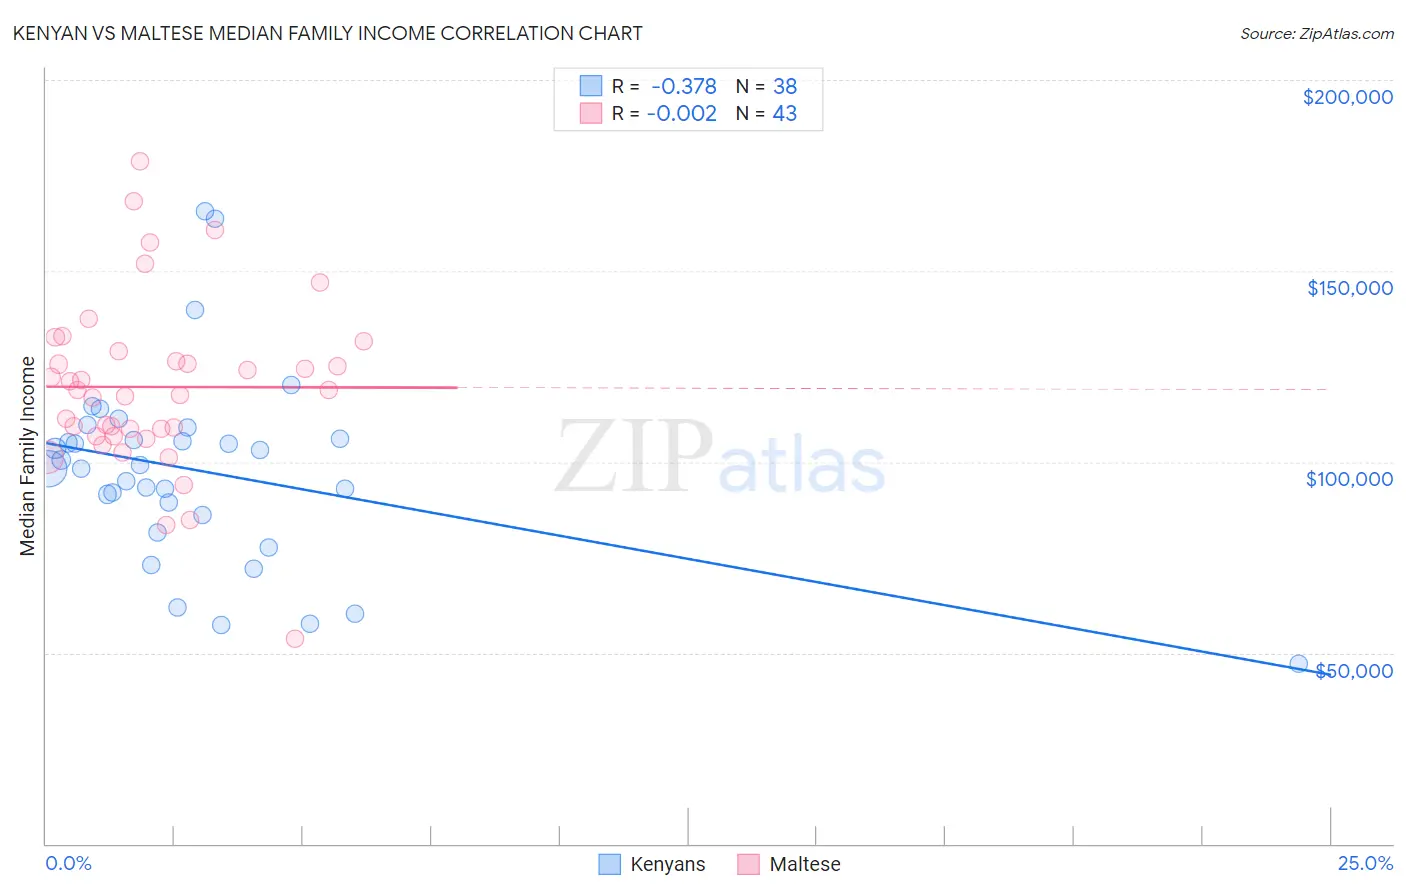
Kenyan vs Maltese Median Family Income Correlation Chart

The statistical analysis conducted on geographies consisting of 168,122,613 people shows a mild negative correlation between the proportion of Kenyans and median family income in the United States with a correlation coefficient (R) of -0.378 and weighted average of $101,417. Similarly, the statistical analysis conducted on geographies consisting of 126,250,272 people shows no correlation between the proportion of Maltese and median family income in the United States with a correlation coefficient (R) of -0.002 and weighted average of $115,862, a difference of 14.2%.
Kenyan vs Maltese Median Family Income

Median Family Income Correlation Summary

MeasurementKenyanMaltese
Minimum$47,000$53,672
Maximum$165,640$178,781
Range$118,640$125,109
Mean$97,471$119,621
Median$98,633$118,717
Interquartile 25% (IQ1)$86,023$106,808
Interquartile 75% (IQ3)$106,111$128,909
Interquartile Range (IQR)$20,088$22,102
Standard Deviation (Sample)$25,158$22,839
Standard Deviation (Population)$24,824$22,571

Similar Demographics by Median Family Income

Demographics Similar to Kenyans by Median Family Income

In terms of median family income, the demographic groups most similar to Kenyans are Immigrants from Costa Rica ($101,354, a difference of 0.060%), Tsimshian ($101,543, a difference of 0.12%), Spaniard ($101,617, a difference of 0.20%), French Canadian ($101,634, a difference of 0.21%), and Dutch ($101,192, a difference of 0.22%).
DemographicsRating | RankMedian Family Income
French
46.1
/100
|
#176
Average
$102,368
Germans
44.6
/100
|
#177
Average
$102,254
Welsh
43.3
/100
|
#178
Average
$102,151
South Americans
39.7
/100
|
#179
Fair
$101,856
French Canadians
37.0
/100
|
#180
Fair
$101,634
Spaniards
36.8
/100
|
#181
Fair
$101,617
Tsimshian
35.9
/100
|
#182
Fair
$101,543
Kenyans
34.5
/100
|
#183
Fair
$101,417
Immigrants | Costa Rica
33.7
/100
|
#184
Fair
$101,354
Dutch
31.9
/100
|
#185
Fair
$101,192
Celtics
31.3
/100
|
#186
Fair
$101,139
Tlingit-Haida
30.8
/100
|
#187
Fair
$101,092
Guamanians/Chamorros
30.5
/100
|
#188
Fair
$101,061
Immigrants | Portugal
29.6
/100
|
#189
Fair
$100,984
Immigrants | Immigrants
29.4
/100
|
#190
Fair
$100,962

Demographics Similar to Maltese by Median Family Income

In terms of median family income, the demographic groups most similar to Maltese are Immigrants from Malaysia ($115,880, a difference of 0.010%), Immigrants from Norway ($115,847, a difference of 0.010%), Immigrants from Czechoslovakia ($116,165, a difference of 0.26%), Chinese ($116,188, a difference of 0.28%), and Immigrants from Europe ($115,523, a difference of 0.29%).
DemographicsRating | RankMedian Family Income
Immigrants | Greece
99.9
/100
|
#45
Exceptional
$117,344
Immigrants | Russia
99.9
/100
|
#46
Exceptional
$116,942
Immigrants | Austria
99.9
/100
|
#47
Exceptional
$116,830
Immigrants | South Africa
99.9
/100
|
#48
Exceptional
$116,286
Chinese
99.9
/100
|
#49
Exceptional
$116,188
Immigrants | Czechoslovakia
99.9
/100
|
#50
Exceptional
$116,165
Immigrants | Malaysia
99.9
/100
|
#51
Exceptional
$115,880
Maltese
99.9
/100
|
#52
Exceptional
$115,862
Immigrants | Norway
99.9
/100
|
#53
Exceptional
$115,847
Immigrants | Europe
99.9
/100
|
#54
Exceptional
$115,523
Lithuanians
99.8
/100
|
#55
Exceptional
$115,395
New Zealanders
99.8
/100
|
#56
Exceptional
$115,230
Greeks
99.8
/100
|
#57
Exceptional
$115,192
Immigrants | Indonesia
99.8
/100
|
#58
Exceptional
$115,162
Immigrants | Netherlands
99.8
/100
|
#59
Exceptional
$114,987