Immigrants from Vietnam vs Immigrants from Middle Africa Median Female Earnings
COMPARE
Immigrants from Vietnam
Immigrants from Middle Africa
Median Female Earnings
Median Female Earnings Comparison
Immigrants from Vietnam
Immigrants from Middle Africa
$40,153
MEDIAN FEMALE EARNINGS
72.0/ 100
METRIC RATING
159th/ 347
METRIC RANK
$37,965
MEDIAN FEMALE EARNINGS
2.7/ 100
METRIC RATING
245th/ 347
METRIC RANK
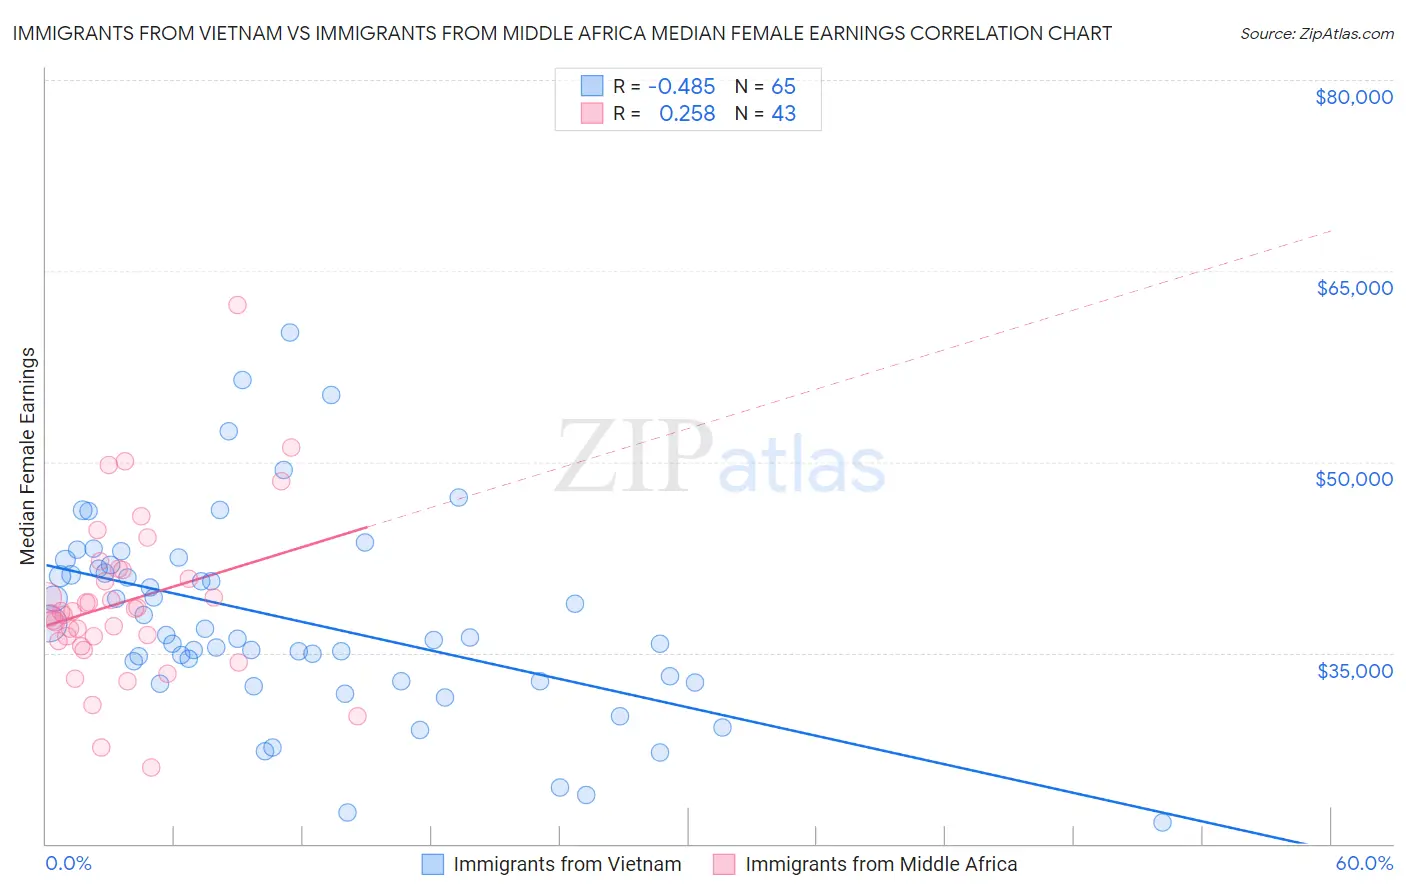
Immigrants from Vietnam vs Immigrants from Middle Africa Median Female Earnings Correlation Chart
The statistical analysis conducted on geographies consisting of 404,736,048 people shows a moderate negative correlation between the proportion of Immigrants from Vietnam and median female earnings in the United States with a correlation coefficient (R) of -0.485 and weighted average of $40,153. Similarly, the statistical analysis conducted on geographies consisting of 202,702,716 people shows a weak positive correlation between the proportion of Immigrants from Middle Africa and median female earnings in the United States with a correlation coefficient (R) of 0.258 and weighted average of $37,965, a difference of 5.8%.
Median Female Earnings Correlation Summary
| Measurement | Immigrants from Vietnam | Immigrants from Middle Africa |
| Minimum | $21,667 | $26,014 |
| Maximum | $60,178 | $62,334 |
| Range | $38,511 | $36,320 |
| Mean | $37,583 | $39,010 |
| Median | $36,210 | $38,230 |
| Interquartile 25% (IQ1) | $32,746 | $35,893 |
| Interquartile 75% (IQ3) | $41,762 | $41,514 |
| Interquartile Range (IQR) | $9,017 | $5,621 |
| Standard Deviation (Sample) | $7,711 | $6,561 |
| Standard Deviation (Population) | $7,652 | $6,484 |
Similar Demographics by Median Female Earnings
Demographics Similar to Immigrants from Vietnam by Median Female Earnings
In terms of median female earnings, the demographic groups most similar to Immigrants from Vietnam are Immigrants from Senegal ($40,157, a difference of 0.010%), Portuguese ($40,177, a difference of 0.060%), Inupiat ($40,080, a difference of 0.18%), Peruvian ($40,234, a difference of 0.20%), and Alsatian ($40,060, a difference of 0.23%).
| Demographics | Rating | Rank | Median Female Earnings |
| West Indians | 78.4 /100 | #152 | Good $40,317 |
| British West Indians | 77.7 /100 | #153 | Good $40,299 |
| Immigrants | Oceania | 77.6 /100 | #154 | Good $40,297 |
| Immigrants | Africa | 76.2 /100 | #155 | Good $40,257 |
| Peruvians | 75.3 /100 | #156 | Good $40,234 |
| Portuguese | 73.0 /100 | #157 | Good $40,177 |
| Immigrants | Senegal | 72.2 /100 | #158 | Good $40,157 |
| Immigrants | Vietnam | 72.0 /100 | #159 | Good $40,153 |
| Inupiat | 68.9 /100 | #160 | Good $40,080 |
| Alsatians | 68.0 /100 | #161 | Good $40,060 |
| South American Indians | 66.1 /100 | #162 | Good $40,019 |
| Lebanese | 65.5 /100 | #163 | Good $40,006 |
| Immigrants | Saudi Arabia | 62.9 /100 | #164 | Good $39,952 |
| Immigrants | Bangladesh | 60.8 /100 | #165 | Good $39,910 |
| Immigrants | Ghana | 60.0 /100 | #166 | Good $39,894 |
Demographics Similar to Immigrants from Middle Africa by Median Female Earnings
In terms of median female earnings, the demographic groups most similar to Immigrants from Middle Africa are Delaware ($37,964, a difference of 0.0%), Immigrants from Liberia ($37,970, a difference of 0.010%), German ($37,986, a difference of 0.050%), Immigrants from Somalia ($37,914, a difference of 0.14%), and Alaskan Athabascan ($37,905, a difference of 0.16%).
| Demographics | Rating | Rank | Median Female Earnings |
| Alaska Natives | 4.3 /100 | #238 | Tragic $38,202 |
| English | 4.2 /100 | #239 | Tragic $38,196 |
| Finns | 4.0 /100 | #240 | Tragic $38,173 |
| Spanish | 3.5 /100 | #241 | Tragic $38,098 |
| Immigrants | Burma/Myanmar | 3.0 /100 | #242 | Tragic $38,028 |
| Germans | 2.8 /100 | #243 | Tragic $37,986 |
| Immigrants | Liberia | 2.7 /100 | #244 | Tragic $37,970 |
| Immigrants | Middle Africa | 2.7 /100 | #245 | Tragic $37,965 |
| Delaware | 2.6 /100 | #246 | Tragic $37,964 |
| Immigrants | Somalia | 2.4 /100 | #247 | Tragic $37,914 |
| Alaskan Athabascans | 2.3 /100 | #248 | Tragic $37,905 |
| Swiss | 2.3 /100 | #249 | Tragic $37,904 |
| Immigrants | Iraq | 2.2 /100 | #250 | Tragic $37,864 |
| Welsh | 2.1 /100 | #251 | Tragic $37,856 |
| Immigrants | Dominica | 2.0 /100 | #252 | Tragic $37,825 |