Immigrants from Vietnam vs Central American Median Female Earnings
COMPARE
Immigrants from Vietnam
Central American
Median Female Earnings
Median Female Earnings Comparison
Immigrants from Vietnam
Central Americans
$40,153
MEDIAN FEMALE EARNINGS
72.0/ 100
METRIC RATING
159th/ 347
METRIC RANK
$36,492
MEDIAN FEMALE EARNINGS
0.1/ 100
METRIC RATING
276th/ 347
METRIC RANK
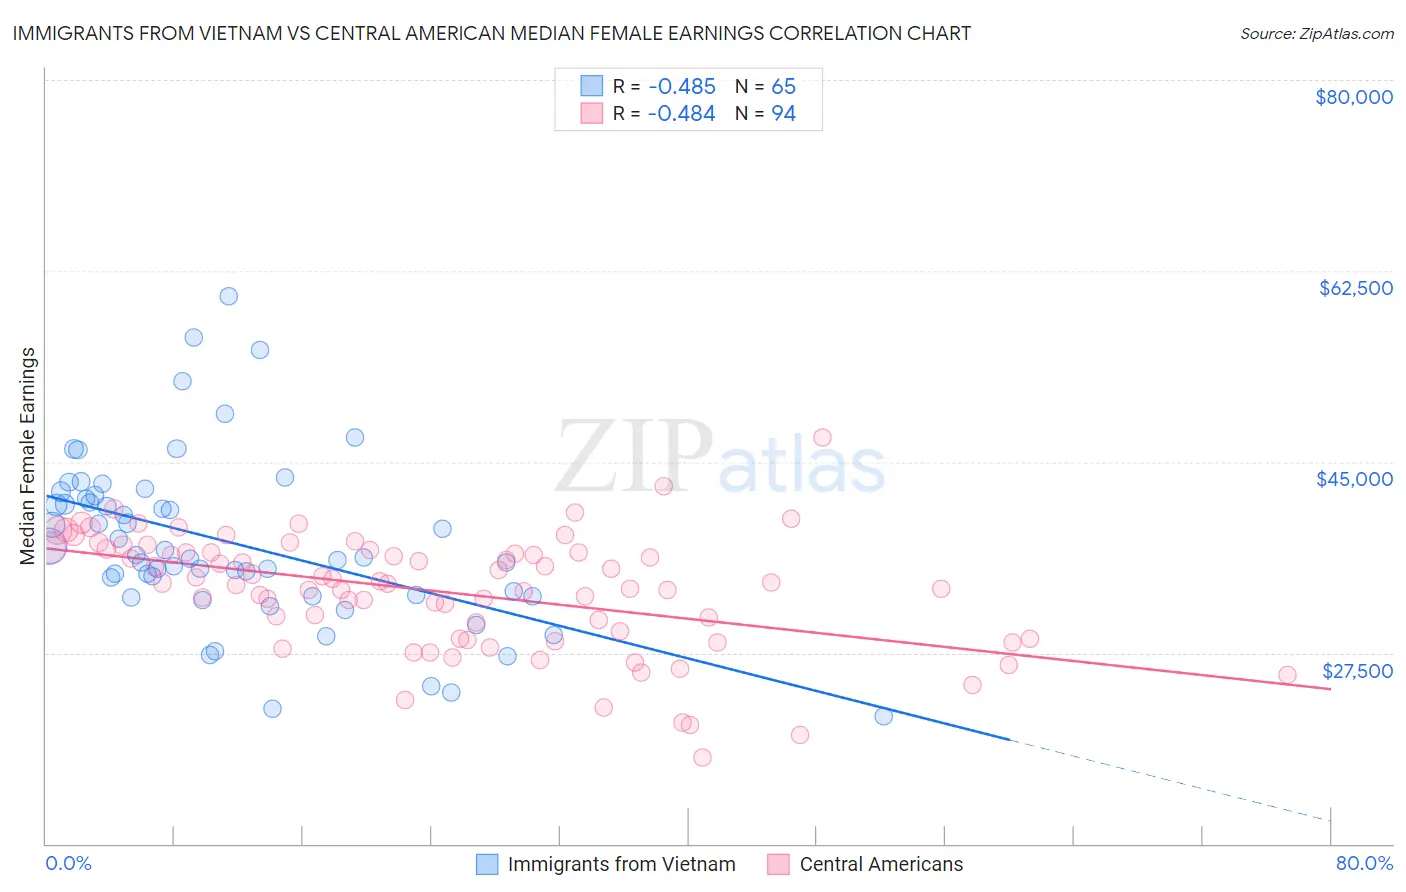
Immigrants from Vietnam vs Central American Median Female Earnings Correlation Chart
The statistical analysis conducted on geographies consisting of 404,736,048 people shows a moderate negative correlation between the proportion of Immigrants from Vietnam and median female earnings in the United States with a correlation coefficient (R) of -0.485 and weighted average of $40,153. Similarly, the statistical analysis conducted on geographies consisting of 504,159,806 people shows a moderate negative correlation between the proportion of Central Americans and median female earnings in the United States with a correlation coefficient (R) of -0.484 and weighted average of $36,492, a difference of 10.0%.
Median Female Earnings Correlation Summary
| Measurement | Immigrants from Vietnam | Central American |
| Minimum | $21,667 | $17,895 |
| Maximum | $60,178 | $47,188 |
| Range | $38,511 | $29,293 |
| Mean | $37,583 | $33,080 |
| Median | $36,210 | $33,869 |
| Interquartile 25% (IQ1) | $32,746 | $28,801 |
| Interquartile 75% (IQ3) | $41,762 | $36,751 |
| Interquartile Range (IQR) | $9,017 | $7,950 |
| Standard Deviation (Sample) | $7,711 | $5,364 |
| Standard Deviation (Population) | $7,652 | $5,336 |
Similar Demographics by Median Female Earnings
Demographics Similar to Immigrants from Vietnam by Median Female Earnings
In terms of median female earnings, the demographic groups most similar to Immigrants from Vietnam are Immigrants from Senegal ($40,157, a difference of 0.010%), Portuguese ($40,177, a difference of 0.060%), Inupiat ($40,080, a difference of 0.18%), Peruvian ($40,234, a difference of 0.20%), and Alsatian ($40,060, a difference of 0.23%).
| Demographics | Rating | Rank | Median Female Earnings |
| West Indians | 78.4 /100 | #152 | Good $40,317 |
| British West Indians | 77.7 /100 | #153 | Good $40,299 |
| Immigrants | Oceania | 77.6 /100 | #154 | Good $40,297 |
| Immigrants | Africa | 76.2 /100 | #155 | Good $40,257 |
| Peruvians | 75.3 /100 | #156 | Good $40,234 |
| Portuguese | 73.0 /100 | #157 | Good $40,177 |
| Immigrants | Senegal | 72.2 /100 | #158 | Good $40,157 |
| Immigrants | Vietnam | 72.0 /100 | #159 | Good $40,153 |
| Inupiat | 68.9 /100 | #160 | Good $40,080 |
| Alsatians | 68.0 /100 | #161 | Good $40,060 |
| South American Indians | 66.1 /100 | #162 | Good $40,019 |
| Lebanese | 65.5 /100 | #163 | Good $40,006 |
| Immigrants | Saudi Arabia | 62.9 /100 | #164 | Good $39,952 |
| Immigrants | Bangladesh | 60.8 /100 | #165 | Good $39,910 |
| Immigrants | Ghana | 60.0 /100 | #166 | Good $39,894 |
Demographics Similar to Central Americans by Median Female Earnings
In terms of median female earnings, the demographic groups most similar to Central Americans are Marshallese ($36,459, a difference of 0.090%), African ($36,530, a difference of 0.10%), U.S. Virgin Islander ($36,424, a difference of 0.19%), Immigrants from Caribbean ($36,414, a difference of 0.22%), and Iroquois ($36,408, a difference of 0.23%).
| Demographics | Rating | Rank | Median Female Earnings |
| Immigrants | Venezuela | 0.4 /100 | #269 | Tragic $37,003 |
| French American Indians | 0.3 /100 | #270 | Tragic $36,920 |
| Nicaraguans | 0.3 /100 | #271 | Tragic $36,904 |
| Immigrants | Dominican Republic | 0.3 /100 | #272 | Tragic $36,857 |
| Immigrants | Laos | 0.3 /100 | #273 | Tragic $36,841 |
| Immigrants | El Salvador | 0.2 /100 | #274 | Tragic $36,673 |
| Africans | 0.1 /100 | #275 | Tragic $36,530 |
| Central Americans | 0.1 /100 | #276 | Tragic $36,492 |
| Marshallese | 0.1 /100 | #277 | Tragic $36,459 |
| U.S. Virgin Islanders | 0.1 /100 | #278 | Tragic $36,424 |
| Immigrants | Caribbean | 0.1 /100 | #279 | Tragic $36,414 |
| Iroquois | 0.1 /100 | #280 | Tragic $36,408 |
| Spanish Americans | 0.1 /100 | #281 | Tragic $36,391 |
| Haitians | 0.1 /100 | #282 | Tragic $36,374 |
| Immigrants | Haiti | 0.1 /100 | #283 | Tragic $36,203 |