Immigrants from Bangladesh vs Mexican Wage/Income Gap

COMPARE

Immigrants from Bangladesh
Race
Ancestry
AfghanAfricanAlaska NativeAlaskan AthabascanAlbanianAleutAlsatianAmericanApacheArabArapahoArgentineanArmenianAssyrian/Chaldean/SyriacAustralianAustrianBahamianBangladeshiBarbadianBasqueBelgianBelizeanBermudanBhutaneseBlackfeetBolivianBrazilianBritishBritish West IndianBulgarianBurmeseCajunCambodianCanadianCape VerdeanCarpatho RusynCelticCentral AmericanCentral American IndianCherokeeCheyenneChickasawChileanChineseChippewaChoctawColombianColvilleComancheCosta RicanCreeCreekCroatianCrowCubanCypriotCzechCzechoslovakianDanishDelawareDominicanDutchDutch West IndianEastern EuropeanEcuadorianEgyptianEnglishEstonianEthiopianEuropeanFijianFilipinoFinnishFrenchFrench American IndianFrench CanadianGermanGerman RussianGhanaianGreekGuamanian/ChamorroGuatemalanGuyaneseHaitianHmongHonduranHopiHoumaHungarianIcelanderIndian (Asian)IndonesianInupiatIranianIraqiIrishIroquoisIsraeliItalianJamaicanJapaneseJordanianKenyanKiowaKoreanLaotianLatvianLebaneseLiberianLithuanianLumbeeLuxembourgerMacedonianMalaysianMalteseMarshalleseMenomineeMexican American IndianMongolianMoroccanNative HawaiianNavajoNepaleseNew ZealanderNicaraguanNigerianNorthern EuropeanNorwegianOkinawanOsageOttawaPaiutePakistaniPalestinianPanamanianParaguayanPennsylvania GermanPeruvianPimaPolishPortuguesePotawatomiPuebloPuerto RicanPuget Sound SalishRomanianRussianSalvadoranSamoanScandinavianScotch-IrishScottishSeminoleSenegaleseSerbianShoshoneSierra LeoneanSiouxSlavicSlovakSloveneSomaliSouth AfricanSouth AmericanSouth American IndianSoviet UnionSpaniardSpanishSpanish AmericanSpanish American IndianSri LankanSubsaharan AfricanSudaneseSwedishSwissSyrianTaiwaneseThaiTlingit-HaidaTohono O'OdhamTonganTrinidadian and TobagonianTsimshianTurkishU.S. Virgin IslanderUgandanUkrainianUruguayanUteVenezuelanVietnameseWelshWest IndianYakamaYaquiYugoslavianYumanYup'ikZimbabwean
Immigration
NonimmigrantsImmigrantsAfghanistanAfricaAlbaniaArgentinaArmeniaAsiaAustraliaAustriaBahamasBangladeshBarbadosBelarusBelgiumBelizeBoliviaBosnia and HerzegovinaBrazilBulgariaBurma/MyanmarCabo VerdeCambodiaCameroonCanadaCaribbeanCentral AmericaChileChinaColombiaCongoCosta RicaCroatiaCubaCzechoslovakiaDenmarkDominicaDominican RepublicEastern AfricaEastern AsiaEastern EuropeEcuadorEgyptEl SalvadorEnglandEritreaEthiopiaEuropeFijiFranceGermanyGhanaGreeceGrenadaGuatemalaGuyanaHaitiHondurasHong KongHungaryIndiaIndonesiaIranIraqIrelandIsraelItalyJamaicaJapanJordanKazakhstanKenyaKoreaKuwaitLaosLatin AmericaLatviaLebanonLiberiaLithuaniaMalaysiaMexicoMicronesiaMiddle AfricaMoldovaMoroccoNepalNetherlandsNicaraguaNigeriaNorth AmericaNorth MacedoniaNorthern AfricaNorthern EuropeNorwayOceaniaPakistanPanamaPeruPhilippinesPolandPortugalRomaniaRussiaSaudi ArabiaScotlandSenegalSerbiaSierra LeoneSingaporeSomaliaSouth AfricaSouth AmericaSouth Central AsiaSouth Eastern AsiaSouthern EuropeSpainSri LankaSt. Vincent and the GrenadinesSudanSwedenSwitzerlandSyriaTaiwanThailandTrinidad and TobagoTurkeyUgandaUkraineUruguayUzbekistanVenezuelaVietnamWest IndiesWestern AfricaWestern AsiaWestern EuropeYemenZaireZimbabweAzores
Mexican
Race
Ancestry
AfghanAfricanAlaska NativeAlaskan AthabascanAlbanianAleutAlsatianAmericanApacheArabArapahoArgentineanArmenianAssyrian/Chaldean/SyriacAustralianAustrianBahamianBangladeshiBarbadianBasqueBelgianBelizeanBermudanBhutaneseBlackfeetBolivianBrazilianBritishBritish West IndianBulgarianBurmeseCajunCambodianCanadianCape VerdeanCarpatho RusynCelticCentral AmericanCentral American IndianCherokeeCheyenneChickasawChileanChineseChippewaChoctawColombianColvilleComancheCosta RicanCreeCreekCroatianCrowCubanCypriotCzechCzechoslovakianDanishDelawareDominicanDutchDutch West IndianEastern EuropeanEcuadorianEgyptianEnglishEstonianEthiopianEuropeanFijianFilipinoFinnishFrenchFrench American IndianFrench CanadianGermanGerman RussianGhanaianGreekGuamanian/ChamorroGuatemalanGuyaneseHaitianHmongHonduranHopiHoumaHungarianIcelanderIndian (Asian)IndonesianInupiatIranianIraqiIrishIroquoisIsraeliItalianJamaicanJapaneseJordanianKenyanKiowaKoreanLaotianLatvianLebaneseLiberianLithuanianLumbeeLuxembourgerMacedonianMalaysianMalteseMarshalleseMenomineeMexicanMexican American IndianMongolianMoroccanNative HawaiianNavajoNepaleseNew ZealanderNicaraguanNigerianNorthern EuropeanNorwegianOkinawanOsageOttawaPaiutePakistaniPalestinianPanamanianParaguayanPennsylvania GermanPeruvianPimaPolishPortuguesePotawatomiPuebloPuerto RicanPuget Sound SalishRomanianRussianSalvadoranSamoanScandinavianScotch-IrishScottishSeminoleSenegaleseSerbianShoshoneSierra LeoneanSiouxSlavicSlovakSloveneSomaliSouth AfricanSouth AmericanSouth American IndianSoviet UnionSpaniardSpanishSpanish AmericanSpanish American IndianSri LankanSubsaharan AfricanSudaneseSwedishSwissSyrianTaiwaneseThaiTlingit-HaidaTohono O'OdhamTonganTrinidadian and TobagonianTsimshianTurkishU.S. Virgin IslanderUgandanUkrainianUruguayanUteVenezuelanVietnameseWelshWest IndianYakamaYaquiYugoslavianYumanYup'ikZimbabwean
Immigration
NonimmigrantsImmigrantsAfghanistanAfricaAlbaniaArgentinaArmeniaAsiaAustraliaAustriaBahamasBarbadosBelarusBelgiumBelizeBoliviaBosnia and HerzegovinaBrazilBulgariaBurma/MyanmarCabo VerdeCambodiaCameroonCanadaCaribbeanCentral AmericaChileChinaColombiaCongoCosta RicaCroatiaCubaCzechoslovakiaDenmarkDominicaDominican RepublicEastern AfricaEastern AsiaEastern EuropeEcuadorEgyptEl SalvadorEnglandEritreaEthiopiaEuropeFijiFranceGermanyGhanaGreeceGrenadaGuatemalaGuyanaHaitiHondurasHong KongHungaryIndiaIndonesiaIranIraqIrelandIsraelItalyJamaicaJapanJordanKazakhstanKenyaKoreaKuwaitLaosLatin AmericaLatviaLebanonLiberiaLithuaniaMalaysiaMexicoMicronesiaMiddle AfricaMoldovaMoroccoNepalNetherlandsNicaraguaNigeriaNorth AmericaNorth MacedoniaNorthern AfricaNorthern EuropeNorwayOceaniaPakistanPanamaPeruPhilippinesPolandPortugalRomaniaRussiaSaudi ArabiaScotlandSenegalSerbiaSierra LeoneSingaporeSomaliaSouth AfricaSouth AmericaSouth Central AsiaSouth Eastern AsiaSouthern EuropeSpainSri LankaSt. Vincent and the GrenadinesSudanSwedenSwitzerlandSyriaTaiwanThailandTrinidad and TobagoTurkeyUgandaUkraineUruguayUzbekistanVenezuelaVietnamWest IndiesWestern AfricaWestern AsiaWestern EuropeYemenZaireZimbabweAzores
Wage/Income Gap
Income
Poverty
Unemployment
Labor Participation
Family Structure
Vehicle Availability
Education Level
Disability

Wage/Income Gap Comparison

Immigrants from Bangladesh

Mexicans

Exceptional
Fair
20.9%
WAGE/INCOME GAP
100.0/ 100
METRIC RATING
30th/ 347
METRIC RANK
26.0%
WAGE/INCOME GAP
34.4/ 100
METRIC RATING
184th/ 347
METRIC RANK

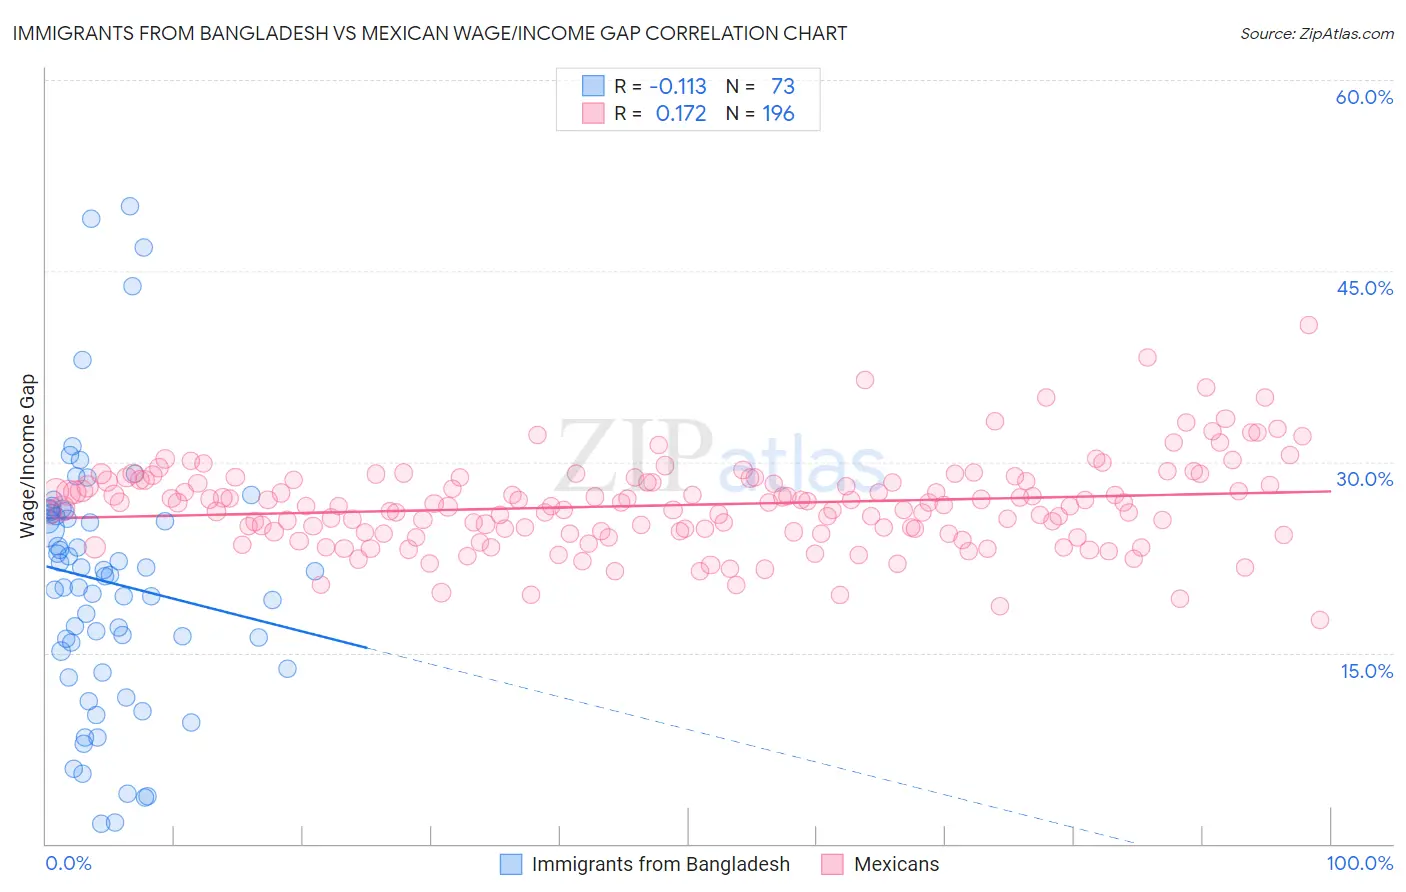
Immigrants from Bangladesh vs Mexican Wage/Income Gap Correlation Chart

The statistical analysis conducted on geographies consisting of 203,640,162 people shows a poor negative correlation between the proportion of Immigrants from Bangladesh and wage/income gap percentage in the United States with a correlation coefficient (R) of -0.113 and weighted average of 20.9%. Similarly, the statistical analysis conducted on geographies consisting of 562,615,908 people shows a poor positive correlation between the proportion of Mexicans and wage/income gap percentage in the United States with a correlation coefficient (R) of 0.172 and weighted average of 26.0%, a difference of 24.3%.
Immigrants from Bangladesh vs Mexican Wage/Income Gap

Wage/Income Gap Correlation Summary

MeasurementImmigrants from BangladeshMexican
Minimum1.6%17.6%
Maximum50.1%40.8%
Range48.5%23.2%
Mean20.6%26.6%
Median21.1%26.6%
Interquartile 25% (IQ1)14.5%24.5%
Interquartile 75% (IQ3)26.1%28.5%
Interquartile Range (IQR)11.6%4.1%
Standard Deviation (Sample)10.2%3.5%
Standard Deviation (Population)10.1%3.5%

Similar Demographics by Wage/Income Gap

Demographics Similar to Immigrants from Bangladesh by Wage/Income Gap

In terms of wage/income gap, the demographic groups most similar to Immigrants from Bangladesh are Immigrants from Senegal (20.9%, a difference of 0.21%), Vietnamese (21.0%, a difference of 0.28%), Immigrants from Yemen (21.1%, a difference of 0.51%), Immigrants from Bahamas (21.1%, a difference of 0.53%), and Pima (21.1%, a difference of 0.81%).
DemographicsRating | RankWage/Income Gap
Immigrants | Dominican Republic
100.0
/100
|
#23
Exceptional
20.6%
Dominicans
100.0
/100
|
#24
Exceptional
20.6%
Senegalese
100.0
/100
|
#25
Exceptional
20.7%
Pueblo
100.0
/100
|
#26
Exceptional
20.7%
Immigrants | Armenia
100.0
/100
|
#27
Exceptional
20.7%
Inupiat
100.0
/100
|
#28
Exceptional
20.8%
Immigrants | Senegal
100.0
/100
|
#29
Exceptional
20.9%
Immigrants | Bangladesh
100.0
/100
|
#30
Exceptional
20.9%
Vietnamese
100.0
/100
|
#31
Exceptional
21.0%
Immigrants | Yemen
100.0
/100
|
#32
Exceptional
21.1%
Immigrants | Bahamas
100.0
/100
|
#33
Exceptional
21.1%
Pima
100.0
/100
|
#34
Exceptional
21.1%
Somalis
100.0
/100
|
#35
Exceptional
21.2%
Belizeans
100.0
/100
|
#36
Exceptional
21.2%
Immigrants | Somalia
100.0
/100
|
#37
Exceptional
21.2%

Demographics Similar to Mexicans by Wage/Income Gap

In terms of wage/income gap, the demographic groups most similar to Mexicans are Pakistani (26.1%, a difference of 0.050%), Immigrants from Kazakhstan (26.0%, a difference of 0.060%), Immigrants from Serbia (26.0%, a difference of 0.070%), Immigrants from Indonesia (26.1%, a difference of 0.13%), and Immigrants from Bolivia (26.0%, a difference of 0.14%).
DemographicsRating | RankWage/Income Gap
Cambodians
45.1
/100
|
#177
Average
25.8%
Chinese
42.0
/100
|
#178
Average
25.9%
Samoans
38.6
/100
|
#179
Fair
26.0%
Guamanians/Chamorros
38.0
/100
|
#180
Fair
26.0%
Immigrants | Bolivia
36.4
/100
|
#181
Fair
26.0%
Immigrants | Serbia
35.4
/100
|
#182
Fair
26.0%
Immigrants | Kazakhstan
35.2
/100
|
#183
Fair
26.0%
Mexicans
34.4
/100
|
#184
Fair
26.0%
Pakistanis
33.7
/100
|
#185
Fair
26.1%
Immigrants | Indonesia
32.5
/100
|
#186
Fair
26.1%
Palestinians
29.9
/100
|
#187
Fair
26.1%
Immigrants | Egypt
29.9
/100
|
#188
Fair
26.1%
Immigrants | Moldova
26.6
/100
|
#189
Fair
26.2%
Immigrants | Croatia
24.8
/100
|
#190
Fair
26.2%
Immigrants | Venezuela
24.7
/100
|
#191
Fair
26.2%