Dutch vs Iroquois Median Female Earnings
COMPARE
Dutch
Iroquois
Median Female Earnings
Median Female Earnings Comparison
Dutch
Iroquois
$37,339
MEDIAN FEMALE EARNINGS
0.7/ 100
METRIC RATING
260th/ 347
METRIC RANK
$36,408
MEDIAN FEMALE EARNINGS
0.1/ 100
METRIC RATING
280th/ 347
METRIC RANK
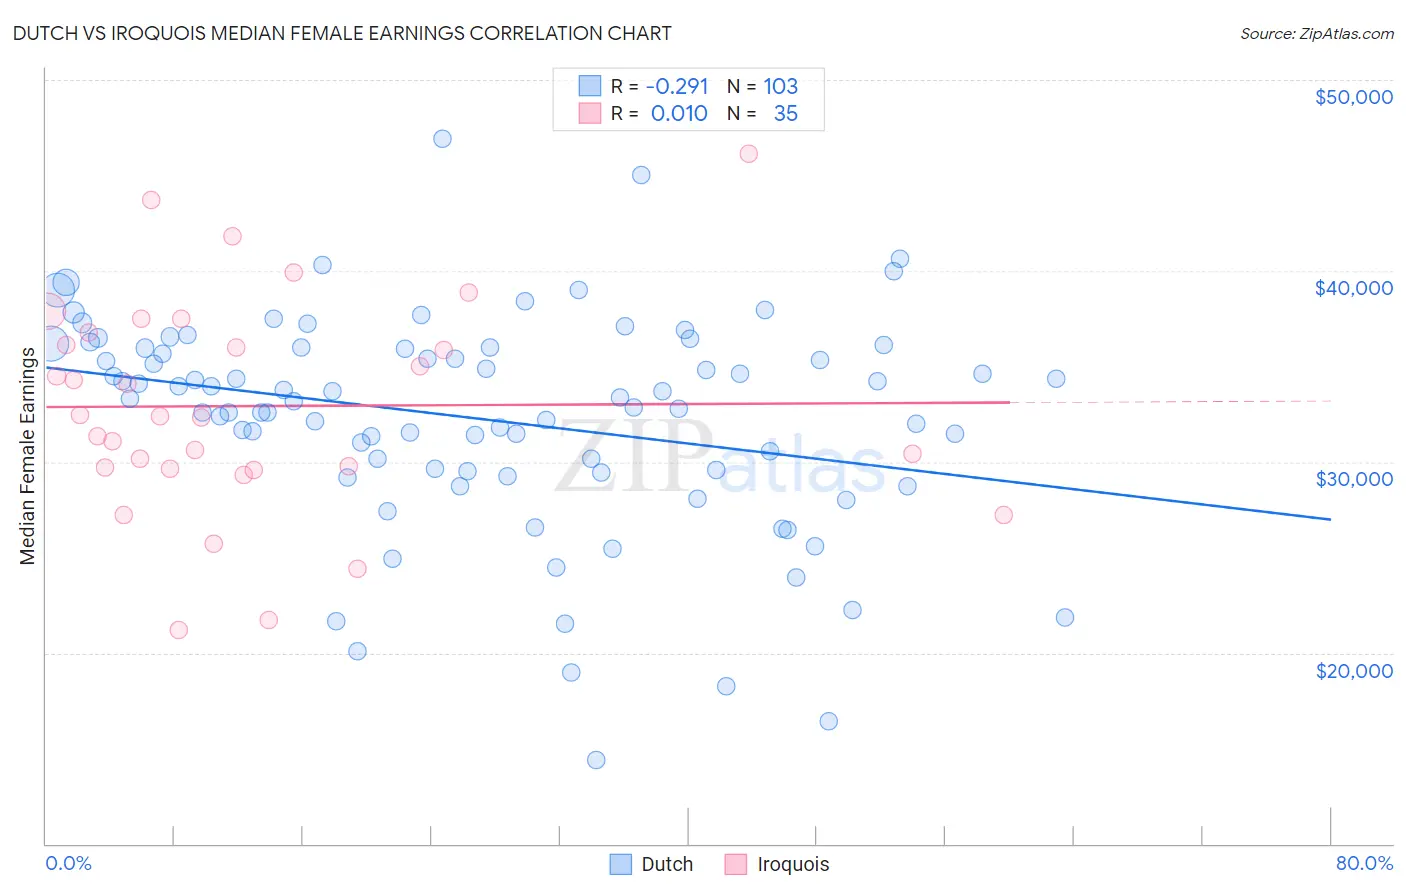
Dutch vs Iroquois Median Female Earnings Correlation Chart
The statistical analysis conducted on geographies consisting of 553,021,757 people shows a weak negative correlation between the proportion of Dutch and median female earnings in the United States with a correlation coefficient (R) of -0.291 and weighted average of $37,339. Similarly, the statistical analysis conducted on geographies consisting of 207,213,781 people shows no correlation between the proportion of Iroquois and median female earnings in the United States with a correlation coefficient (R) of 0.010 and weighted average of $36,408, a difference of 2.6%.
Median Female Earnings Correlation Summary
| Measurement | Dutch | Iroquois |
| Minimum | $14,375 | $21,202 |
| Maximum | $46,907 | $46,154 |
| Range | $32,532 | $24,952 |
| Mean | $32,260 | $32,927 |
| Median | $33,299 | $32,405 |
| Interquartile 25% (IQ1) | $29,508 | $29,643 |
| Interquartile 75% (IQ3) | $35,979 | $36,768 |
| Interquartile Range (IQR) | $6,471 | $7,125 |
| Standard Deviation (Sample) | $5,704 | $5,712 |
| Standard Deviation (Population) | $5,676 | $5,630 |
Demographics Similar to Dutch and Iroquois by Median Female Earnings
In terms of median female earnings, the demographic groups most similar to Dutch are Malaysian ($37,298, a difference of 0.11%), Venezuelan ($37,282, a difference of 0.15%), German Russian ($37,105, a difference of 0.63%), Salvadoran ($37,083, a difference of 0.69%), and Immigrants from Belize ($37,056, a difference of 0.76%). Similarly, the demographic groups most similar to Iroquois are Immigrants from Caribbean ($36,414, a difference of 0.020%), U.S. Virgin Islander ($36,424, a difference of 0.050%), Marshallese ($36,459, a difference of 0.14%), Central American ($36,492, a difference of 0.23%), and African ($36,530, a difference of 0.34%).
| Demographics | Rating | Rank | Median Female Earnings |
| Dutch | 0.7 /100 | #260 | Tragic $37,339 |
| Malaysians | 0.7 /100 | #261 | Tragic $37,298 |
| Venezuelans | 0.7 /100 | #262 | Tragic $37,282 |
| German Russians | 0.5 /100 | #263 | Tragic $37,105 |
| Salvadorans | 0.4 /100 | #264 | Tragic $37,083 |
| Immigrants | Belize | 0.4 /100 | #265 | Tragic $37,056 |
| Dominicans | 0.4 /100 | #266 | Tragic $37,046 |
| Immigrants | Nonimmigrants | 0.4 /100 | #267 | Tragic $37,024 |
| Cree | 0.4 /100 | #268 | Tragic $37,018 |
| Immigrants | Venezuela | 0.4 /100 | #269 | Tragic $37,003 |
| French American Indians | 0.3 /100 | #270 | Tragic $36,920 |
| Nicaraguans | 0.3 /100 | #271 | Tragic $36,904 |
| Immigrants | Dominican Republic | 0.3 /100 | #272 | Tragic $36,857 |
| Immigrants | Laos | 0.3 /100 | #273 | Tragic $36,841 |
| Immigrants | El Salvador | 0.2 /100 | #274 | Tragic $36,673 |
| Africans | 0.1 /100 | #275 | Tragic $36,530 |
| Central Americans | 0.1 /100 | #276 | Tragic $36,492 |
| Marshallese | 0.1 /100 | #277 | Tragic $36,459 |
| U.S. Virgin Islanders | 0.1 /100 | #278 | Tragic $36,424 |
| Immigrants | Caribbean | 0.1 /100 | #279 | Tragic $36,414 |
| Iroquois | 0.1 /100 | #280 | Tragic $36,408 |