South American vs Iroquois Median Female Earnings
COMPARE
South American
Iroquois
Median Female Earnings
Median Female Earnings Comparison
South Americans
Iroquois
$39,698
MEDIAN FEMALE EARNINGS
50.0/ 100
METRIC RATING
174th/ 347
METRIC RANK
$36,408
MEDIAN FEMALE EARNINGS
0.1/ 100
METRIC RATING
280th/ 347
METRIC RANK
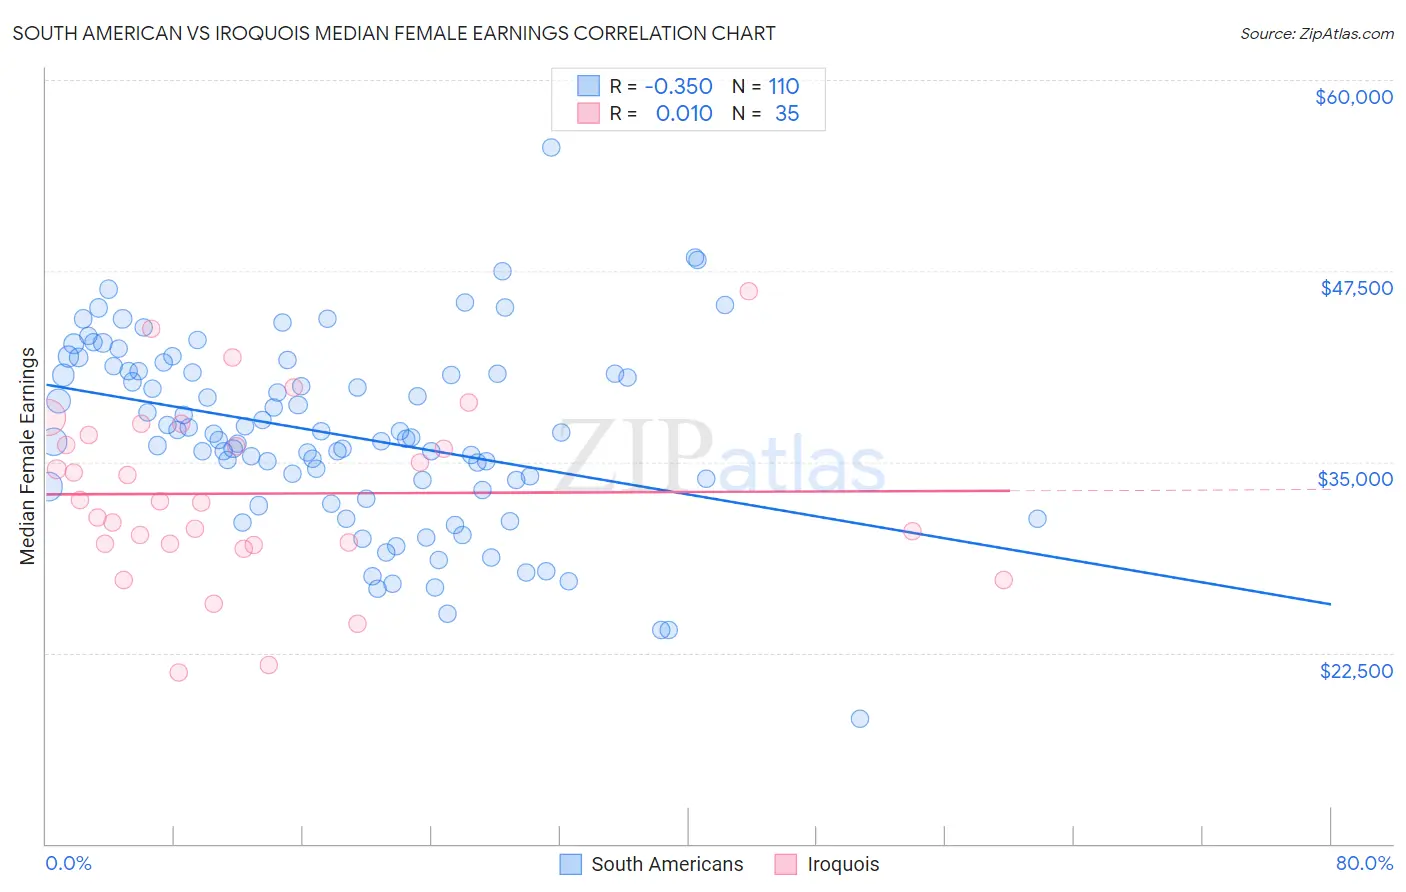
South American vs Iroquois Median Female Earnings Correlation Chart
The statistical analysis conducted on geographies consisting of 493,793,554 people shows a mild negative correlation between the proportion of South Americans and median female earnings in the United States with a correlation coefficient (R) of -0.350 and weighted average of $39,698. Similarly, the statistical analysis conducted on geographies consisting of 207,213,781 people shows no correlation between the proportion of Iroquois and median female earnings in the United States with a correlation coefficient (R) of 0.010 and weighted average of $36,408, a difference of 9.0%.
Median Female Earnings Correlation Summary
| Measurement | South American | Iroquois |
| Minimum | $18,150 | $21,202 |
| Maximum | $55,607 | $46,154 |
| Range | $37,457 | $24,952 |
| Mean | $36,804 | $32,927 |
| Median | $36,715 | $32,405 |
| Interquartile 25% (IQ1) | $33,376 | $29,643 |
| Interquartile 75% (IQ3) | $40,920 | $36,768 |
| Interquartile Range (IQR) | $7,545 | $7,125 |
| Standard Deviation (Sample) | $6,134 | $5,712 |
| Standard Deviation (Population) | $6,106 | $5,630 |
Similar Demographics by Median Female Earnings
Demographics Similar to South Americans by Median Female Earnings
In terms of median female earnings, the demographic groups most similar to South Americans are Canadian ($39,724, a difference of 0.070%), Immigrants from South America ($39,643, a difference of 0.14%), Nigerian ($39,641, a difference of 0.14%), British ($39,772, a difference of 0.19%), and Costa Rican ($39,622, a difference of 0.19%).
| Demographics | Rating | Rank | Median Female Earnings |
| Luxembourgers | 59.9 /100 | #167 | Average $39,891 |
| Immigrants | Peru | 58.9 /100 | #168 | Average $39,871 |
| Kenyans | 58.4 /100 | #169 | Average $39,860 |
| Slovenes | 56.2 /100 | #170 | Average $39,817 |
| Immigrants | Portugal | 54.7 /100 | #171 | Average $39,788 |
| British | 53.8 /100 | #172 | Average $39,772 |
| Canadians | 51.4 /100 | #173 | Average $39,724 |
| South Americans | 50.0 /100 | #174 | Average $39,698 |
| Immigrants | South America | 47.2 /100 | #175 | Average $39,643 |
| Nigerians | 47.0 /100 | #176 | Average $39,641 |
| Costa Ricans | 46.1 /100 | #177 | Average $39,622 |
| Slavs | 45.6 /100 | #178 | Average $39,613 |
| Immigrants | Germany | 45.1 /100 | #179 | Average $39,603 |
| Immigrants | Kenya | 41.6 /100 | #180 | Average $39,535 |
| Tsimshian | 41.4 /100 | #181 | Average $39,530 |
Demographics Similar to Iroquois by Median Female Earnings
In terms of median female earnings, the demographic groups most similar to Iroquois are Immigrants from Caribbean ($36,414, a difference of 0.020%), U.S. Virgin Islander ($36,424, a difference of 0.050%), Spanish American ($36,391, a difference of 0.050%), Haitian ($36,374, a difference of 0.090%), and Marshallese ($36,459, a difference of 0.14%).
| Demographics | Rating | Rank | Median Female Earnings |
| Immigrants | Laos | 0.3 /100 | #273 | Tragic $36,841 |
| Immigrants | El Salvador | 0.2 /100 | #274 | Tragic $36,673 |
| Africans | 0.1 /100 | #275 | Tragic $36,530 |
| Central Americans | 0.1 /100 | #276 | Tragic $36,492 |
| Marshallese | 0.1 /100 | #277 | Tragic $36,459 |
| U.S. Virgin Islanders | 0.1 /100 | #278 | Tragic $36,424 |
| Immigrants | Caribbean | 0.1 /100 | #279 | Tragic $36,414 |
| Iroquois | 0.1 /100 | #280 | Tragic $36,408 |
| Spanish Americans | 0.1 /100 | #281 | Tragic $36,391 |
| Haitians | 0.1 /100 | #282 | Tragic $36,374 |
| Immigrants | Haiti | 0.1 /100 | #283 | Tragic $36,203 |
| Indonesians | 0.1 /100 | #284 | Tragic $36,140 |
| Paiute | 0.1 /100 | #285 | Tragic $36,056 |
| Osage | 0.0 /100 | #286 | Tragic $36,034 |
| Immigrants | Nicaragua | 0.0 /100 | #287 | Tragic $36,023 |