Dutch vs Immigrants from Russia Median Female Earnings
COMPARE
Dutch
Immigrants from Russia
Median Female Earnings
Median Female Earnings Comparison
Dutch
Immigrants from Russia
$37,339
MEDIAN FEMALE EARNINGS
0.7/ 100
METRIC RATING
260th/ 347
METRIC RANK
$44,680
MEDIAN FEMALE EARNINGS
100.0/ 100
METRIC RATING
28th/ 347
METRIC RANK
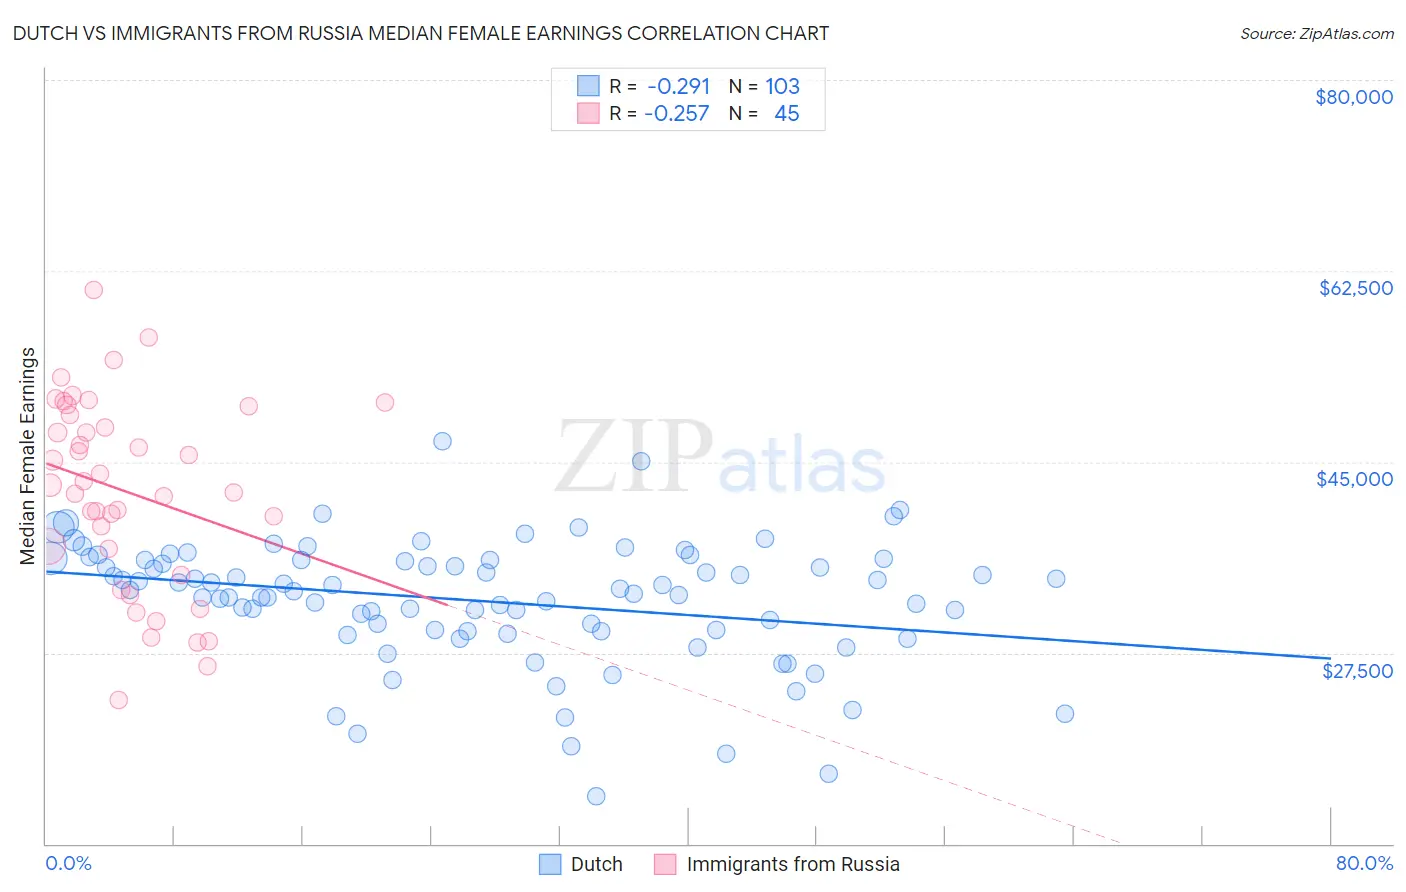
Dutch vs Immigrants from Russia Median Female Earnings Correlation Chart
The statistical analysis conducted on geographies consisting of 553,021,757 people shows a weak negative correlation between the proportion of Dutch and median female earnings in the United States with a correlation coefficient (R) of -0.291 and weighted average of $37,339. Similarly, the statistical analysis conducted on geographies consisting of 347,839,336 people shows a weak negative correlation between the proportion of Immigrants from Russia and median female earnings in the United States with a correlation coefficient (R) of -0.257 and weighted average of $44,680, a difference of 19.7%.
Median Female Earnings Correlation Summary
| Measurement | Dutch | Immigrants from Russia |
| Minimum | $14,375 | $23,199 |
| Maximum | $46,907 | $60,754 |
| Range | $32,532 | $37,555 |
| Mean | $32,260 | $42,242 |
| Median | $33,299 | $42,848 |
| Interquartile 25% (IQ1) | $29,508 | $35,838 |
| Interquartile 75% (IQ3) | $35,979 | $49,732 |
| Interquartile Range (IQR) | $6,471 | $13,894 |
| Standard Deviation (Sample) | $5,704 | $8,738 |
| Standard Deviation (Population) | $5,676 | $8,640 |
Similar Demographics by Median Female Earnings
Demographics Similar to Dutch by Median Female Earnings
In terms of median female earnings, the demographic groups most similar to Dutch are Malaysian ($37,298, a difference of 0.11%), Scotch-Irish ($37,383, a difference of 0.12%), Venezuelan ($37,282, a difference of 0.15%), Belizean ($37,429, a difference of 0.24%), and Hawaiian ($37,497, a difference of 0.42%).
| Demographics | Rating | Rank | Median Female Earnings |
| Danes | 1.6 /100 | #253 | Tragic $37,730 |
| Whites/Caucasians | 1.1 /100 | #254 | Tragic $37,531 |
| Colville | 1.1 /100 | #255 | Tragic $37,514 |
| Samoans | 1.0 /100 | #256 | Tragic $37,498 |
| Hawaiians | 1.0 /100 | #257 | Tragic $37,497 |
| Belizeans | 0.9 /100 | #258 | Tragic $37,429 |
| Scotch-Irish | 0.8 /100 | #259 | Tragic $37,383 |
| Dutch | 0.7 /100 | #260 | Tragic $37,339 |
| Malaysians | 0.7 /100 | #261 | Tragic $37,298 |
| Venezuelans | 0.7 /100 | #262 | Tragic $37,282 |
| German Russians | 0.5 /100 | #263 | Tragic $37,105 |
| Salvadorans | 0.4 /100 | #264 | Tragic $37,083 |
| Immigrants | Belize | 0.4 /100 | #265 | Tragic $37,056 |
| Dominicans | 0.4 /100 | #266 | Tragic $37,046 |
| Immigrants | Nonimmigrants | 0.4 /100 | #267 | Tragic $37,024 |
Demographics Similar to Immigrants from Russia by Median Female Earnings
In terms of median female earnings, the demographic groups most similar to Immigrants from Russia are Turkish ($44,695, a difference of 0.030%), Immigrants from Belarus ($44,757, a difference of 0.17%), Immigrants from Sweden ($44,774, a difference of 0.21%), Immigrants from Belgium ($44,587, a difference of 0.21%), and Asian ($44,586, a difference of 0.21%).
| Demographics | Rating | Rank | Median Female Earnings |
| Cambodians | 100.0 /100 | #21 | Exceptional $45,014 |
| Immigrants | Greece | 100.0 /100 | #22 | Exceptional $44,976 |
| Burmese | 100.0 /100 | #23 | Exceptional $44,911 |
| Immigrants | Korea | 100.0 /100 | #24 | Exceptional $44,847 |
| Immigrants | Sweden | 100.0 /100 | #25 | Exceptional $44,774 |
| Immigrants | Belarus | 100.0 /100 | #26 | Exceptional $44,757 |
| Turks | 100.0 /100 | #27 | Exceptional $44,695 |
| Immigrants | Russia | 100.0 /100 | #28 | Exceptional $44,680 |
| Immigrants | Belgium | 100.0 /100 | #29 | Exceptional $44,587 |
| Asians | 100.0 /100 | #30 | Exceptional $44,586 |
| Immigrants | France | 100.0 /100 | #31 | Exceptional $44,541 |
| Immigrants | Northern Europe | 100.0 /100 | #32 | Exceptional $44,366 |
| Immigrants | Asia | 100.0 /100 | #33 | Exceptional $44,198 |
| Russians | 100.0 /100 | #34 | Exceptional $44,169 |
| Immigrants | Sri Lanka | 100.0 /100 | #35 | Exceptional $44,161 |