Barbadian vs Samoan Median Family Income
COMPARE
Barbadian
Samoan
Median Family Income
Median Family Income Comparison
Barbadians
Samoans
$93,919
MEDIAN FAMILY INCOME
1.1/ 100
METRIC RATING
242nd/ 347
METRIC RANK
$100,344
MEDIAN FAMILY INCOME
23.3/ 100
METRIC RATING
196th/ 347
METRIC RANK
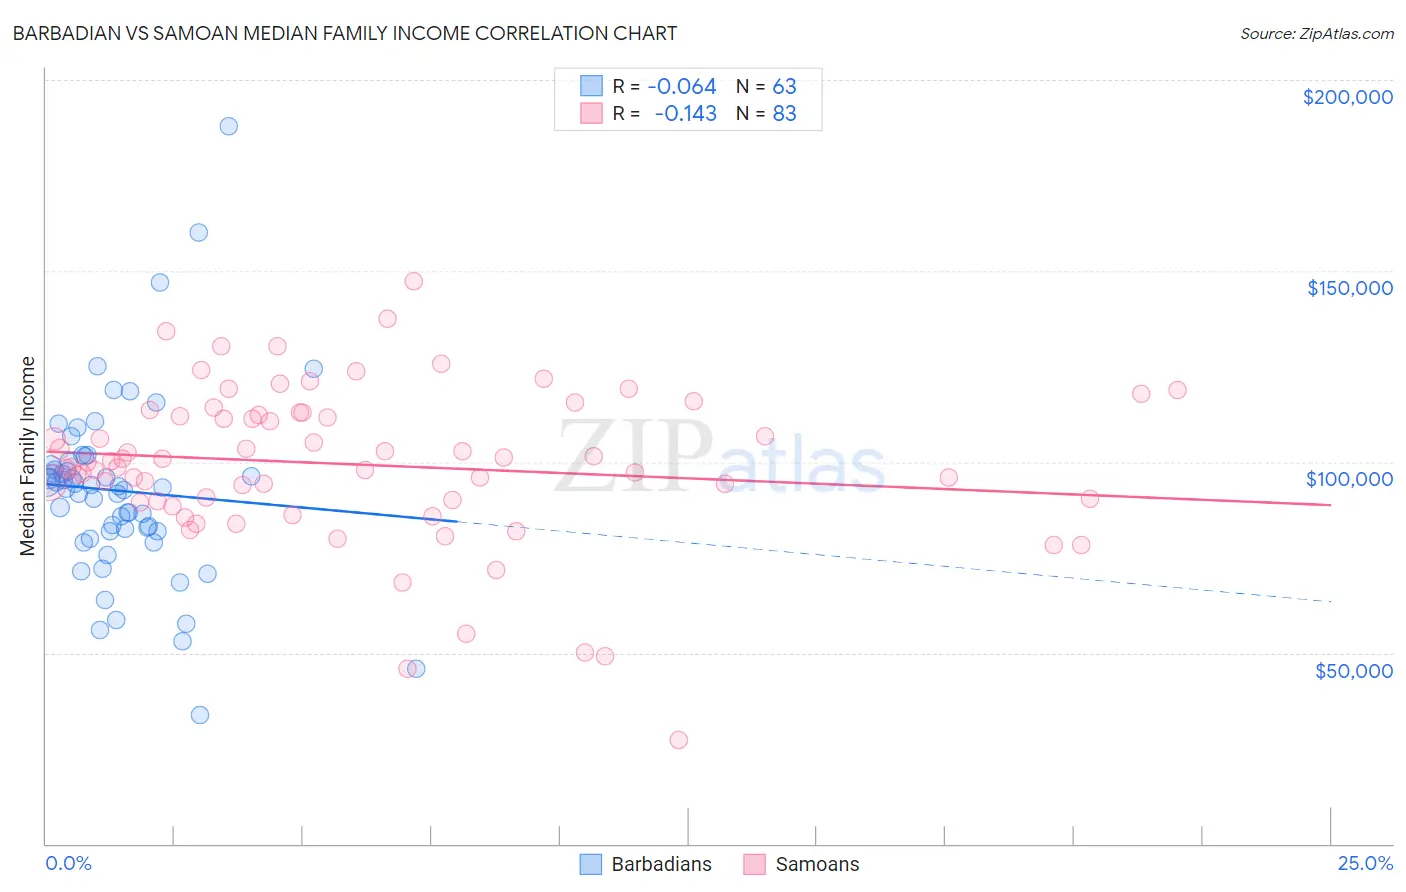
Barbadian vs Samoan Median Family Income Correlation Chart
The statistical analysis conducted on geographies consisting of 141,221,123 people shows a slight negative correlation between the proportion of Barbadians and median family income in the United States with a correlation coefficient (R) of -0.064 and weighted average of $93,919. Similarly, the statistical analysis conducted on geographies consisting of 225,048,976 people shows a poor negative correlation between the proportion of Samoans and median family income in the United States with a correlation coefficient (R) of -0.143 and weighted average of $100,344, a difference of 6.8%.
Median Family Income Correlation Summary
| Measurement | Barbadian | Samoan |
| Minimum | $33,750 | $27,294 |
| Maximum | $188,047 | $147,200 |
| Range | $154,297 | $119,906 |
| Mean | $92,437 | $99,252 |
| Median | $93,405 | $99,920 |
| Interquartile 25% (IQ1) | $81,674 | $89,665 |
| Interquartile 75% (IQ3) | $100,271 | $112,813 |
| Interquartile Range (IQR) | $18,597 | $23,148 |
| Standard Deviation (Sample) | $24,591 | $20,629 |
| Standard Deviation (Population) | $24,395 | $20,504 |
Similar Demographics by Median Family Income
Demographics Similar to Barbadians by Median Family Income
In terms of median family income, the demographic groups most similar to Barbadians are German Russian ($93,858, a difference of 0.060%), Immigrants from Trinidad and Tobago ($93,988, a difference of 0.070%), Somali ($94,085, a difference of 0.18%), Subsaharan African ($93,748, a difference of 0.18%), and Salvadoran ($94,109, a difference of 0.20%).
| Demographics | Rating | Rank | Median Family Income |
| Immigrants | Burma/Myanmar | 1.5 /100 | #235 | Tragic $94,472 |
| Trinidadians and Tobagonians | 1.5 /100 | #236 | Tragic $94,466 |
| Alaskan Athabascans | 1.5 /100 | #237 | Tragic $94,429 |
| Nepalese | 1.3 /100 | #238 | Tragic $94,153 |
| Salvadorans | 1.2 /100 | #239 | Tragic $94,109 |
| Somalis | 1.2 /100 | #240 | Tragic $94,085 |
| Immigrants | Trinidad and Tobago | 1.2 /100 | #241 | Tragic $93,988 |
| Barbadians | 1.1 /100 | #242 | Tragic $93,919 |
| German Russians | 1.1 /100 | #243 | Tragic $93,858 |
| Sub-Saharan Africans | 1.0 /100 | #244 | Tragic $93,748 |
| Immigrants | Middle Africa | 1.0 /100 | #245 | Tragic $93,593 |
| Guyanese | 0.9 /100 | #246 | Tragic $93,373 |
| Immigrants | Senegal | 0.7 /100 | #247 | Tragic $92,912 |
| French American Indians | 0.7 /100 | #248 | Tragic $92,872 |
| Immigrants | Ecuador | 0.7 /100 | #249 | Tragic $92,837 |
Demographics Similar to Samoans by Median Family Income
In terms of median family income, the demographic groups most similar to Samoans are Immigrants from Cameroon ($100,289, a difference of 0.060%), Immigrants from South America ($100,414, a difference of 0.070%), Immigrants from Africa ($100,256, a difference of 0.090%), Yugoslavian ($100,119, a difference of 0.22%), and Iraqi ($100,658, a difference of 0.31%).
| Demographics | Rating | Rank | Median Family Income |
| Immigrants | Portugal | 29.6 /100 | #189 | Fair $100,984 |
| Immigrants | Immigrants | 29.4 /100 | #190 | Fair $100,962 |
| Colombians | 27.2 /100 | #191 | Fair $100,750 |
| Immigrants | Kenya | 26.5 /100 | #192 | Fair $100,679 |
| Iraqis | 26.3 /100 | #193 | Fair $100,658 |
| Uruguayans | 26.3 /100 | #194 | Fair $100,656 |
| Immigrants | South America | 23.9 /100 | #195 | Fair $100,414 |
| Samoans | 23.3 /100 | #196 | Fair $100,344 |
| Immigrants | Cameroon | 22.8 /100 | #197 | Fair $100,289 |
| Immigrants | Africa | 22.5 /100 | #198 | Fair $100,256 |
| Yugoslavians | 21.3 /100 | #199 | Fair $100,119 |
| Spanish | 20.1 /100 | #200 | Fair $99,977 |
| Immigrants | Thailand | 19.0 /100 | #201 | Poor $99,840 |
| Whites/Caucasians | 18.7 /100 | #202 | Poor $99,800 |
| Scotch-Irish | 17.1 /100 | #203 | Poor $99,591 |