Zip Codes with the Highest Percentage of Population Employed in Administrative & Support Services in Greenwood, IN
RELATED REPORTS & OPTIONS
Administrative & Support Services
Greenwood
Compare Zip Codes
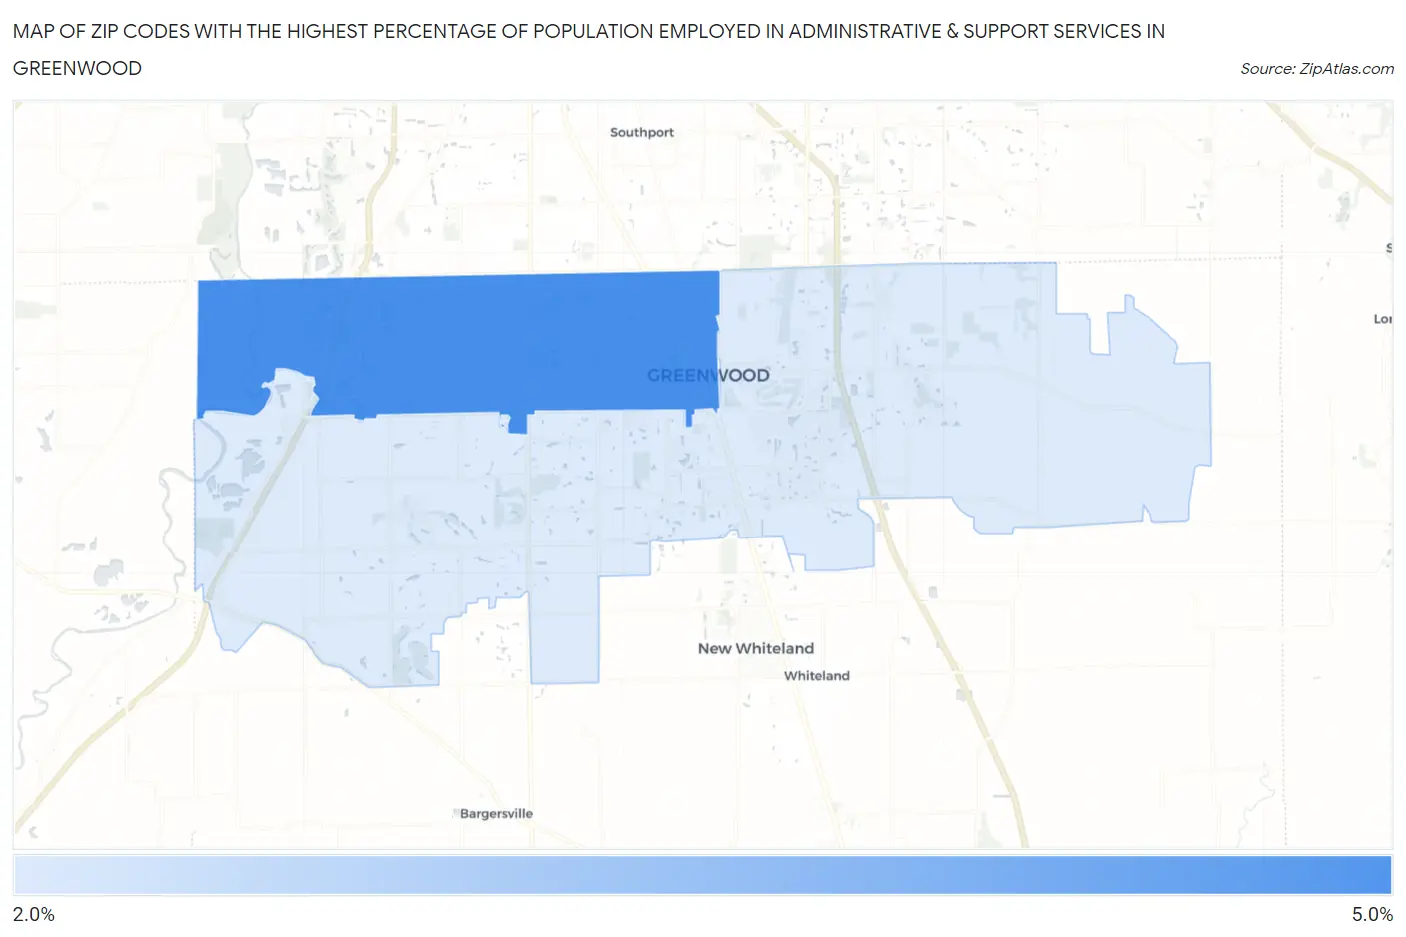
Map of Zip Codes with the Highest Percentage of Population Employed in Administrative & Support Services in Greenwood
0.0%
5.0%
Zip Codes with the Highest Percentage of Population Employed in Administrative & Support Services in Greenwood, IN
| Zip Code | % Employed | vs State | vs National | |
| 1. | 46142 | 4.1% | 3.5%(+0.613)#225 | 4.1%(-0.008)#10,071 |
| 2. | 46143 | 2.2% | 3.5%(-1.28)#460 | 4.1%(-1.90)#19,438 |
1
Common Questions
What are the Top Zip Codes with the Highest Percentage of Population Employed in Administrative & Support Services in Greenwood, IN?
Top Zip Codes with the Highest Percentage of Population Employed in Administrative & Support Services in Greenwood, IN are:
What zip code has the Highest Percentage of Population Employed in Administrative & Support Services in Greenwood, IN?
46142 has the Highest Percentage of Population Employed in Administrative & Support Services in Greenwood, IN with 4.1%.
What is the Percentage of Population Employed in Administrative & Support Services in Greenwood, IN?
Percentage of Population Employed in Administrative & Support Services in Greenwood is 2.4%.
What is the Percentage of Population Employed in Administrative & Support Services in Indiana?
Percentage of Population Employed in Administrative & Support Services in Indiana is 3.5%.
What is the Percentage of Population Employed in Administrative & Support Services in the United States?
Percentage of Population Employed in Administrative & Support Services in the United States is 4.1%.