Zip Codes with the Most Immigrants from Kuwait in Illinois

RELATED REPORTS & OPTIONS

Kuwait
Population
Families and Households
Female Fertility
Female Fertility (Unmarried)
Race (Community Size)
Race (Percentage)
Ancestry (Community Size)
AfghanAfricanAlaska NativeAlaskan AthabascanAlbanianAleutAlsatianAmericanApacheArabArapahoArgentineanArmenianAssyrian / Chaldean / SyriacAustralianAustrianBahamianBangladeshiBarbadianBasqueBelgianBelizeanBermudanBhutaneseBlackfeetBolivianBrazilianBritishBritish West IndianBulgarianBurmeseCajunCambodianCanadianCape VerdeanCarpatho RusynCelticCentral AmericanCentral American IndianCherokeeCheyenneChickasawChileanChineseChippewaChoctawColombianColvilleComancheCosta RicanCreeCreekCroatianCrowCubanCypriotCzechCzechoslovakianDanishDelawareDominicanDutchDutch West IndianEastern EuropeanEcuadorianEgyptianEnglishEstonianEthiopianEuropeanFijianFilipinoFinnishFrenchFrench American IndianFrench CanadianGermanGerman RussianGhanaianGreekGuamanian / ChamorroGuatemalanGuyaneseHaitianHmongHonduranHopiHoumaHungarianIcelanderIndian (Asian)IndonesianInupiatIranianIraqiIrishIroquoisIsraeliItalianJamaicanJapaneseJordanianKenyanKiowaKoreanLaotianLatvianLebaneseLiberianLithuanianLumbeeLuxembourgerMacedonianMalaysianMalteseMarshalleseMenomineeMexicanMexican American IndianMongolianMoroccanNative HawaiianNavajoNepaleseNew ZealanderNicaraguanNigerianNorthern EuropeanNorwegianOkinawanOsageOttawaPaiutePakistaniPalestinianPanamanianParaguayanPennsylvania GermanPeruvianPimaPolishPortuguesePotawatomiPuebloPuerto RicanPuget Sound SalishRomanianRussianSalvadoranSamoanScandinavianScotch-IrishScottishSeminoleSenegaleseSerbianShoshoneSierra LeoneanSiouxSlavicSlovakSloveneSomaliSouth AfricanSouth AmericanSouth American IndianSoviet UnionSpaniardSpanishSpanish AmericanSpanish American IndianSri LankanSubsaharan AfricanSudaneseSwedishSwissSyrianTaiwaneseThaiTlingit-HaidaTohono O'OdhamTonganTrinidadian and TobagonianTsimshianTurkishU.S. Virgin IslanderUgandanUkrainianUruguayanUteVenezuelanVietnameseWelshWest IndianYakamaYaquiYugoslavianYumanYup'ikZimbabwean
Ancestry (Percentage)
AfghanAfricanAlaska NativeAlaskan AthabascanAlbanianAleutAlsatianAmericanApacheArabArapahoArgentineanArmenianAssyrian / Chaldean / SyriacAustralianAustrianBahamianBangladeshiBarbadianBasqueBelgianBelizeanBermudanBhutaneseBlackfeetBolivianBrazilianBritishBritish West IndianBulgarianBurmeseCajunCambodianCanadianCape VerdeanCarpatho RusynCelticCentral AmericanCentral American IndianCherokeeCheyenneChickasawChileanChineseChippewaChoctawColombianColvilleComancheCosta RicanCreeCreekCroatianCrowCubanCypriotCzechCzechoslovakianDanishDelawareDominicanDutchDutch West IndianEastern EuropeanEcuadorianEgyptianEnglishEstonianEthiopianEuropeanFijianFilipinoFinnishFrenchFrench American IndianFrench CanadianGermanGerman RussianGhanaianGreekGuamanian / ChamorroGuatemalanGuyaneseHaitianHmongHonduranHopiHoumaHungarianIcelanderIndian (Asian)IndonesianInupiatIranianIraqiIrishIroquoisIsraeliItalianJamaicanJapaneseJordanianKenyanKiowaKoreanLaotianLatvianLebaneseLiberianLithuanianLumbeeLuxembourgerMacedonianMalaysianMalteseMarshalleseMenomineeMexicanMexican American IndianMongolianMoroccanNative HawaiianNavajoNepaleseNew ZealanderNicaraguanNigerianNorthern EuropeanNorwegianOkinawanOsageOttawaPaiutePakistaniPalestinianPanamanianParaguayanPennsylvania GermanPeruvianPimaPolishPortuguesePotawatomiPuebloPuerto RicanPuget Sound SalishRomanianRussianSalvadoranSamoanScandinavianScotch-IrishScottishSeminoleSenegaleseSerbianShoshoneSierra LeoneanSiouxSlavicSlovakSloveneSomaliSouth AfricanSouth AmericanSouth American IndianSoviet UnionSpaniardSpanishSpanish AmericanSpanish American IndianSri LankanSubsaharan AfricanSudaneseSwedishSwissSyrianTaiwaneseThaiTlingit-HaidaTohono O'OdhamTonganTrinidadian and TobagonianTsimshianTurkishU.S. Virgin IslanderUgandanUkrainianUruguayanUteVenezuelanVietnameseWelshWest IndianYakamaYaquiYugoslavianYumanYup'ikZimbabwean
Immigrant Origin (Total)
AfghanistanAfricaAlbaniaArgentinaArmeniaAsiaAustraliaAustriaAzoresBahamasBangladeshBarbadosBelarusBelgiumBelizeBoliviaBosnia and HerzegovinaBrazilBulgariaBurma / MyanmarCabo VerdeCambodiaCameroonCanadaCaribbeanCentral AmericaChileChinaColombiaCongoCosta RicaCroatiaCubaCzechoslovakiaDenmarkDominicaDominican RepublicEastern AfricaEastern AsiaEastern EuropeEcuadorEgyptEl SalvadorEnglandEritreaEthiopiaEuropeFijiFranceGermanyGhanaGreeceGrenadaGuatemalaGuyanaHaitiHondurasHong KongHungaryIndiaIndonesiaIranIraqIrelandIsraelItalyJamaicaJapanJordanKazakhstanKenyaKoreaKuwaitLaosLatin AmericaLatviaLebanonLiberiaLithuaniaMalaysiaMexicoMicronesiaMiddle AfricaMoldovaMoroccoNepalNetherlandsNicaraguaNigeriaNorth MacedoniaNorthern AfricaNorthern EuropeNorwayOceaniaPakistanPanamaPeruPhilippinesPolandPortugalRomaniaRussiaSaudi ArabiaScotlandSenegalSerbiaSierra LeoneSingaporeSomaliaSouth AfricaSouth AmericaSouth Central AsiaSouth Eastern AsiaSouthern EuropeSpainSri LankaSt. Vincent and the GrenadinesSudanSwedenSwitzerlandSyriaTaiwanThailandTrinidad and TobagoTurkeyUgandaUkraineUruguayUzbekistanVenezuelaVietnamWest IndiesWestern AfricaWestern AsiaWestern EuropeYemenZaireZimbabwe
Immigrant Origin (Percentage)
AfghanistanAfricaAlbaniaArgentinaArmeniaAsiaAustraliaAustriaAzoresBahamasBangladeshBarbadosBelarusBelgiumBelizeBoliviaBosnia and HerzegovinaBrazilBulgariaBurma / MyanmarCabo VerdeCambodiaCameroonCanadaCaribbeanCentral AmericaChileChinaColombiaCongoCosta RicaCroatiaCubaCzechoslovakiaDenmarkDominicaDominican RepublicEastern AfricaEastern AsiaEastern EuropeEcuadorEgyptEl SalvadorEnglandEritreaEthiopiaEuropeFijiFranceGermanyGhanaGreeceGrenadaGuatemalaGuyanaHaitiHondurasHong KongHungaryIndiaIndonesiaIranIraqIrelandIsraelItalyJamaicaJapanJordanKazakhstanKenyaKoreaKuwaitLaosLatin AmericaLatviaLebanonLiberiaLithuaniaMalaysiaMexicoMicronesiaMiddle AfricaMoldovaMoroccoNepalNetherlandsNicaraguaNigeriaNorth MacedoniaNorthern AfricaNorthern EuropeNorwayOceaniaPakistanPanamaPeruPhilippinesPolandPortugalRomaniaRussiaSaudi ArabiaScotlandSenegalSerbiaSierra LeoneSingaporeSomaliaSouth AfricaSouth AmericaSouth Central AsiaSouth Eastern AsiaSouthern EuropeSpainSri LankaSt. Vincent and the GrenadinesSudanSwedenSwitzerlandSyriaTaiwanThailandTrinidad and TobagoTurkeyUgandaUkraineUruguayUzbekistanVenezuelaVietnamWest IndiesWestern AfricaWestern AsiaWestern EuropeYemenZaireZimbabwe
Income
Income (Families)
Income (Households)
Poverty
Poverty (Families)
Unemployment
Employment Occupations
Employment Industries
Employer Class
Commute Time
Commute Means
School Enrollment
Education by Degree Field
Occupancy
Finances
Physical Characteristics
Illinois
Compare Zip Codes
Comparison Subject

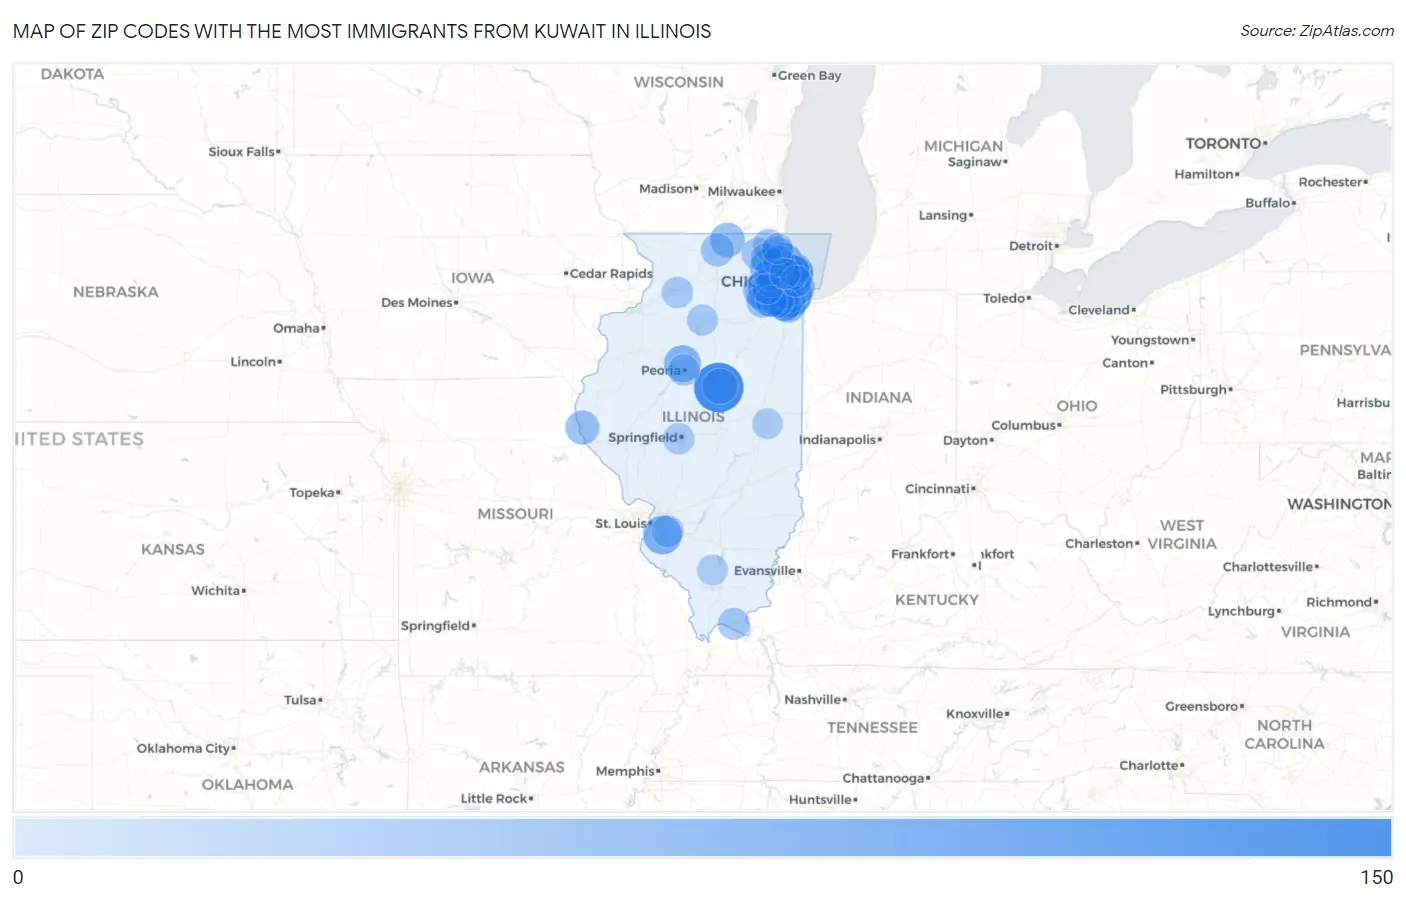
Map of Zip Codes with the Most Immigrants from Kuwait in Illinois

0
150
Zip Codes with the Most Immigrants from Kuwait in Illinois Map

Zip Codes with the Most Immigrants from Kuwait in Illinois

Zip Code Kuwait vs State vs National
1.617051211,630(7.42%)#135,679(0.34%)#37
2.604531021,630(6.26%)#235,679(0.29%)#59
3.60415641,630(3.93%)#335,679(0.18%)#128
4.60660561,630(3.44%)#435,679(0.16%)#151
5.60462541,630(3.31%)#535,679(0.15%)#164
6.60062531,630(3.25%)#635,679(0.15%)#167
7.62220521,630(3.19%)#735,679(0.15%)#179
8.60630511,630(3.13%)#835,679(0.14%)#182
9.60169461,630(2.82%)#935,679(0.13%)#215
10.60477451,630(2.76%)#1035,679(0.13%)#223
11.60455421,630(2.58%)#1135,679(0.12%)#238
12.61615411,630(2.52%)#1235,679(0.11%)#248
13.60659401,630(2.45%)#1335,679(0.11%)#251
14.60007391,630(2.39%)#1435,679(0.11%)#260
15.60640381,630(2.33%)#1535,679(0.11%)#267
16.60458381,630(2.33%)#1635,679(0.11%)#273
17.60504371,630(2.27%)#1735,679(0.10%)#274
18.60131371,630(2.27%)#1835,679(0.10%)#280
19.60446361,630(2.21%)#1935,679(0.10%)#288
20.60176361,630(2.21%)#2035,679(0.10%)#293
21.61704321,630(1.96%)#2135,679(0.09%)#324
22.60564291,630(1.78%)#2235,679(0.08%)#358
23.60622271,630(1.66%)#2335,679(0.08%)#381
24.60637271,630(1.66%)#2435,679(0.08%)#382
25.61065271,630(1.66%)#2535,679(0.08%)#397
26.60563261,630(1.60%)#2635,679(0.07%)#407
27.60714261,630(1.60%)#2735,679(0.07%)#409
28.60480241,630(1.47%)#2835,679(0.07%)#454
29.60302231,630(1.41%)#2935,679(0.06%)#461
30.62301231,630(1.41%)#3035,679(0.06%)#464
31.60625221,630(1.35%)#3135,679(0.06%)#477
32.60459221,630(1.35%)#3235,679(0.06%)#487
33.60467221,630(1.35%)#3335,679(0.06%)#491
34.60061201,630(1.23%)#3435,679(0.06%)#529
35.61107161,630(0.98%)#3535,679(0.04%)#635
36.60544151,630(0.92%)#3635,679(0.04%)#674
37.60803151,630(0.92%)#3735,679(0.04%)#680
38.60457151,630(0.92%)#3835,679(0.04%)#685
39.60641141,630(0.86%)#3935,679(0.04%)#692
40.60487141,630(0.86%)#4035,679(0.04%)#702
41.60101131,630(0.80%)#4135,679(0.04%)#735
42.60491121,630(0.74%)#4235,679(0.03%)#780
43.60137111,630(0.67%)#4335,679(0.03%)#798
44.62221111,630(0.67%)#4435,679(0.03%)#804
45.60626101,630(0.61%)#4535,679(0.03%)#845
46.60014101,630(0.61%)#4635,679(0.03%)#846
47.6007391,630(0.55%)#4735,679(0.03%)#886
48.6010891,630(0.55%)#4835,679(0.03%)#916
49.6296091,630(0.55%)#4935,679(0.03%)#930
50.6001081,630(0.49%)#5035,679(0.02%)#943
51.6044181,630(0.49%)#5135,679(0.02%)#955
52.6009071,630(0.43%)#5235,679(0.02%)#997
53.6060571,630(0.43%)#5335,679(0.02%)#1,003
54.6160671,630(0.43%)#5435,679(0.02%)#1,032
55.6270461,630(0.37%)#5535,679(0.02%)#1,045
56.6107161,630(0.37%)#5635,679(0.02%)#1,069
57.6135951,630(0.31%)#5735,679(0.01%)#1,111
58.6054041,630(0.25%)#5835,679(0.01%)#1,119
59.6004841,630(0.25%)#5935,679(0.01%)#1,123
60.6286531,630(0.18%)#6035,679(0.01%)#1,150
61.6070621,630(0.12%)#6135,679(0.01%)#1,161
62.6186421,630(0.12%)#6235,679(0.01%)#1,170

Common Questions

What are the Top 10 Zip Codes with the Most Immigrants from Kuwait in Illinois?
Top 10 Zip Codes with the Most Immigrants from Kuwait in Illinois are:
#1
121
#2
102
#3
64
#4
56
#5
54
#6
53
#7
52
#8
51
#9
46
#10
45
What zip code has the Most Immigrants from Kuwait in Illinois?
61705 has the Most Immigrants from Kuwait in Illinois with 121.
What is the Total Immigrants from Kuwait in the State of Illinois?
Total Immigrants from Kuwait in Illinois is 1,630.
What is the Total Immigrants from Kuwait in the United States?
Total Immigrants from Kuwait in the United States is 35,679.