Zip Codes with the Highest Percentage of Population with a Degree in Arts and Humanities in Quincy, IL
RELATED REPORTS & OPTIONS
Arts and Humanities
Quincy
Compare Zip Codes
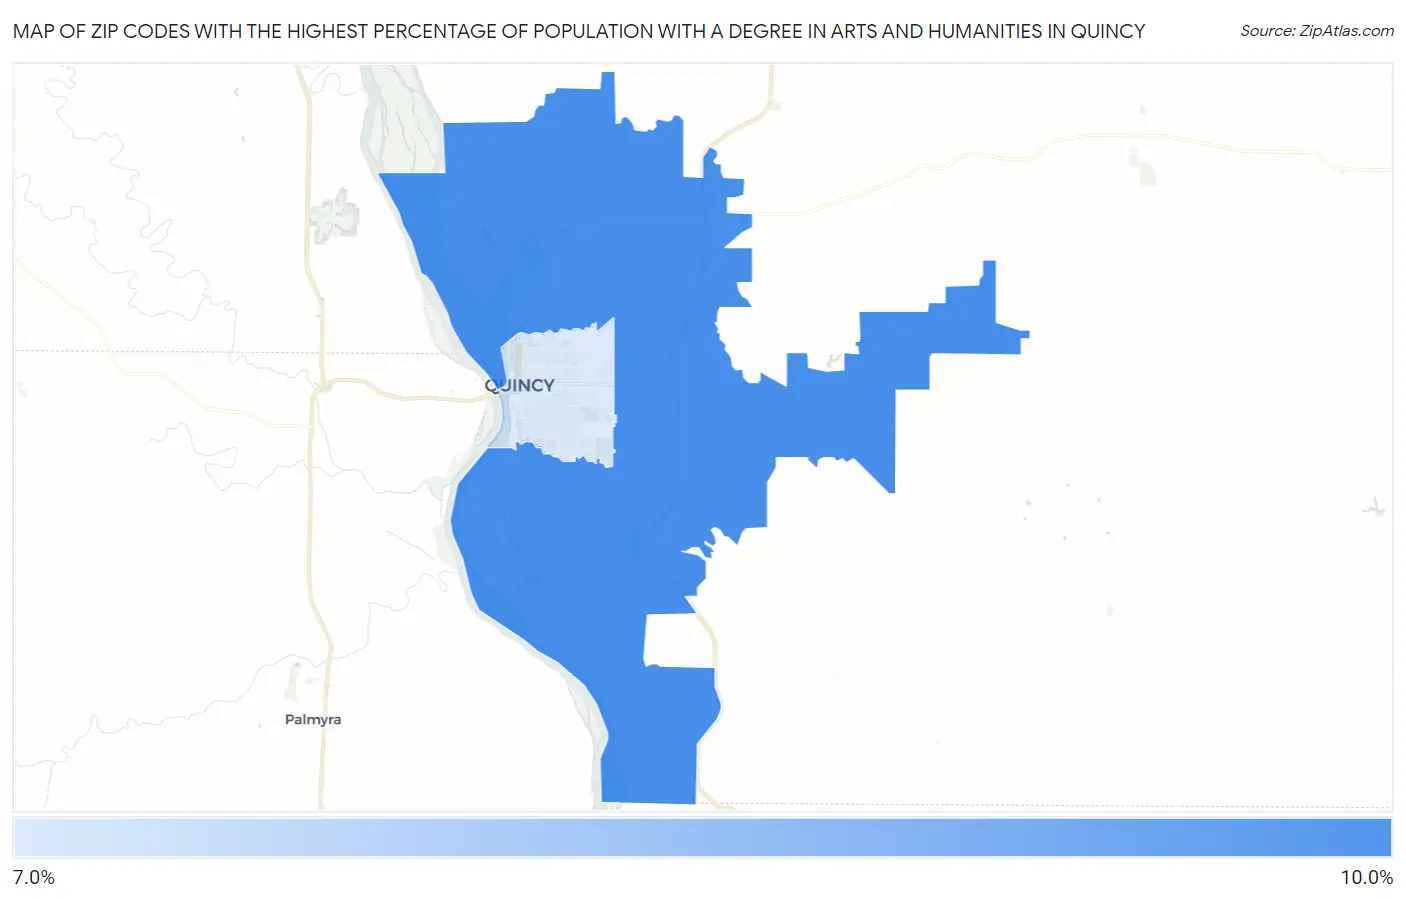
Map of Zip Codes with the Highest Percentage of Population with a Degree in Arts and Humanities in Quincy
0.0%
10.0%
Zip Codes with the Highest Percentage of Population with a Degree in Arts and Humanities in Quincy, IL
| Zip Code | % Graduates | vs State | vs National | |
| 1. | 62305 | 8.8% | 5.5%(+3.30)#389 | 6.0%(+2.80)#8,097 |
| 2. | 62301 | 7.4% | 5.5%(+1.90)#496 | 6.0%(+1.40)#11,004 |
1
Common Questions
What are the Top Zip Codes with the Highest Percentage of Population with a Degree in Arts and Humanities in Quincy, IL?
Top Zip Codes with the Highest Percentage of Population with a Degree in Arts and Humanities in Quincy, IL are:
What zip code has the Highest Percentage of Population with a Degree in Arts and Humanities in Quincy, IL?
62305 has the Highest Percentage of Population with a Degree in Arts and Humanities in Quincy, IL with 8.8%.
What is the Percentage of Population with a Degree in Arts and Humanities in Quincy, IL?
Percentage of Population with a Degree in Arts and Humanities in Quincy is 7.8%.
What is the Percentage of Population with a Degree in Arts and Humanities in Illinois?
Percentage of Population with a Degree in Arts and Humanities in Illinois is 5.5%.
What is the Percentage of Population with a Degree in Arts and Humanities in the United States?
Percentage of Population with a Degree in Arts and Humanities in the United States is 6.0%.