Zip Codes with the Highest Percentage of Population with a Degree in Visual and Performing Arts in Waterloo, IA
RELATED REPORTS & OPTIONS
Visual and Performing Arts
Waterloo
Compare Zip Codes
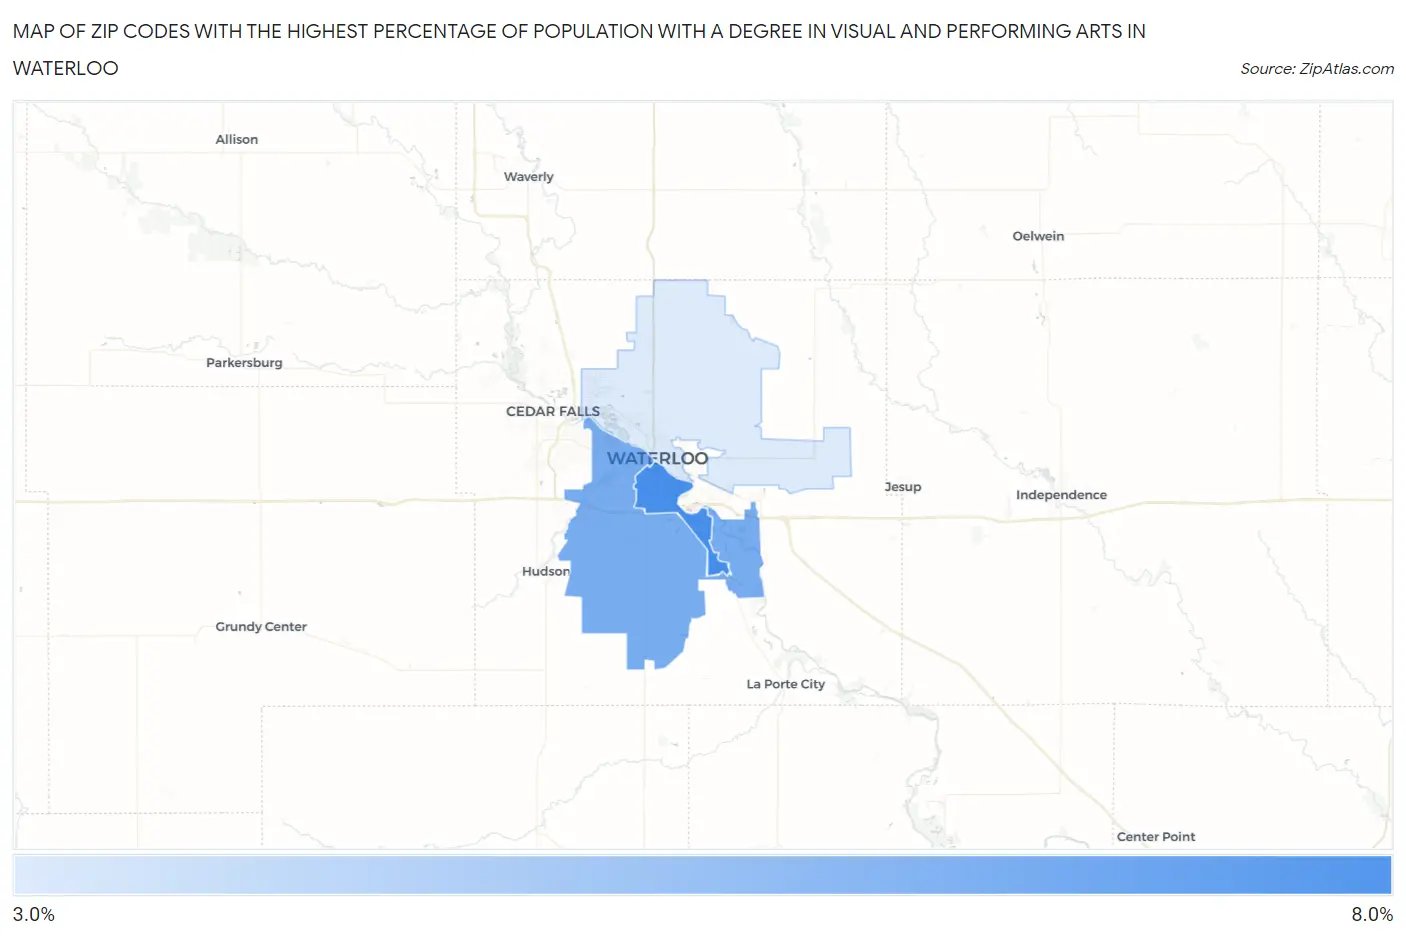
Map of Zip Codes with the Highest Percentage of Population with a Degree in Visual and Performing Arts in Waterloo
0.0%
8.0%
Zip Codes with the Highest Percentage of Population with a Degree in Visual and Performing Arts in Waterloo, IA
| Zip Code | % Graduates | vs State | vs National | |
| 1. | 50702 | 6.8% | 3.5%(+3.26)#82 | 4.3%(+2.52)#3,911 |
| 2. | 50701 | 5.7% | 3.5%(+2.21)#111 | 4.3%(+1.46)#5,309 |
| 3. | 50703 | 3.6% | 3.5%(+0.108)#216 | 4.3%(-0.641)#10,460 |
1
Common Questions
What are the Top Zip Codes with the Highest Percentage of Population with a Degree in Visual and Performing Arts in Waterloo, IA?
Top Zip Codes with the Highest Percentage of Population with a Degree in Visual and Performing Arts in Waterloo, IA are:
What zip code has the Highest Percentage of Population with a Degree in Visual and Performing Arts in Waterloo, IA?
50702 has the Highest Percentage of Population with a Degree in Visual and Performing Arts in Waterloo, IA with 6.8%.
What is the Percentage of Population with a Degree in Visual and Performing Arts in Waterloo, IA?
Percentage of Population with a Degree in Visual and Performing Arts in Waterloo is 5.9%.
What is the Percentage of Population with a Degree in Visual and Performing Arts in Iowa?
Percentage of Population with a Degree in Visual and Performing Arts in Iowa is 3.5%.
What is the Percentage of Population with a Degree in Visual and Performing Arts in the United States?
Percentage of Population with a Degree in Visual and Performing Arts in the United States is 4.3%.