Zip Codes with the Highest Percentage of Population Employed in Administrative & Support Services in Waterloo, IA
RELATED REPORTS & OPTIONS
Administrative & Support Services
Waterloo
Compare Zip Codes
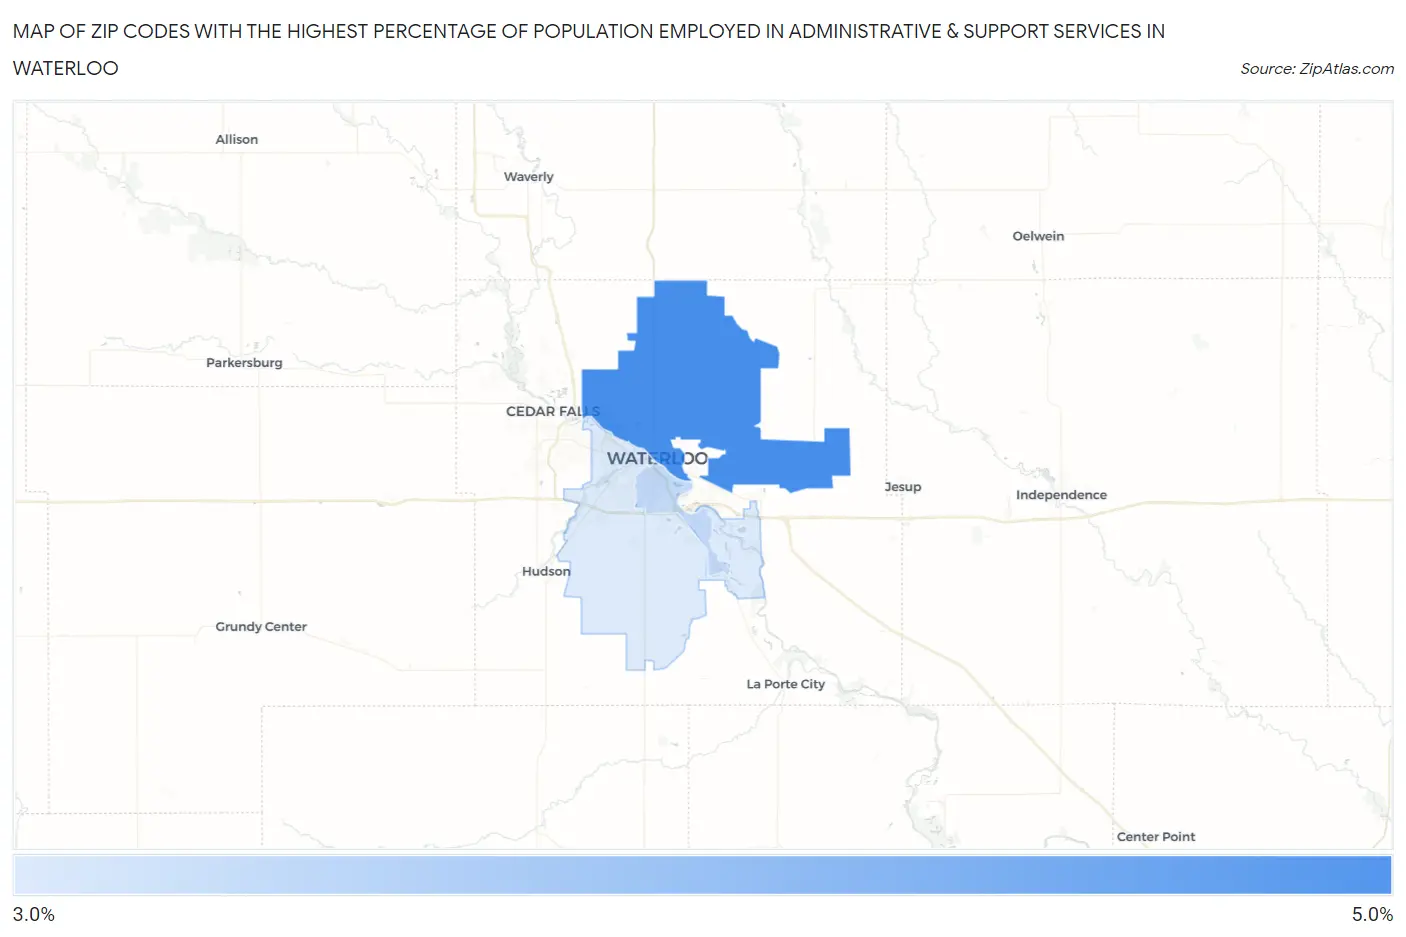
Map of Zip Codes with the Highest Percentage of Population Employed in Administrative & Support Services in Waterloo
0.0%
5.0%
Zip Codes with the Highest Percentage of Population Employed in Administrative & Support Services in Waterloo, IA
| Zip Code | % Employed | vs State | vs National | |
| 1. | 50703 | 4.3% | 3.0%(+1.27)#173 | 4.1%(+0.151)#9,450 |
| 2. | 50702 | 3.7% | 3.0%(+0.659)#230 | 4.1%(-0.462)#12,040 |
| 3. | 50701 | 3.6% | 3.0%(+0.525)#245 | 4.1%(-0.596)#12,691 |
1
Common Questions
What are the Top Zip Codes with the Highest Percentage of Population Employed in Administrative & Support Services in Waterloo, IA?
Top Zip Codes with the Highest Percentage of Population Employed in Administrative & Support Services in Waterloo, IA are:
What zip code has the Highest Percentage of Population Employed in Administrative & Support Services in Waterloo, IA?
50703 has the Highest Percentage of Population Employed in Administrative & Support Services in Waterloo, IA with 4.3%.
What is the Percentage of Population Employed in Administrative & Support Services in Waterloo, IA?
Percentage of Population Employed in Administrative & Support Services in Waterloo is 3.8%.
What is the Percentage of Population Employed in Administrative & Support Services in Iowa?
Percentage of Population Employed in Administrative & Support Services in Iowa is 3.0%.
What is the Percentage of Population Employed in Administrative & Support Services in the United States?
Percentage of Population Employed in Administrative & Support Services in the United States is 4.1%.