Zip Codes with the Highest Percentage of Population Employed in Health Diagnosing & Treating in Davenport, IA
RELATED REPORTS & OPTIONS
Health Diagnosing & Treating
Davenport
Compare Zip Codes
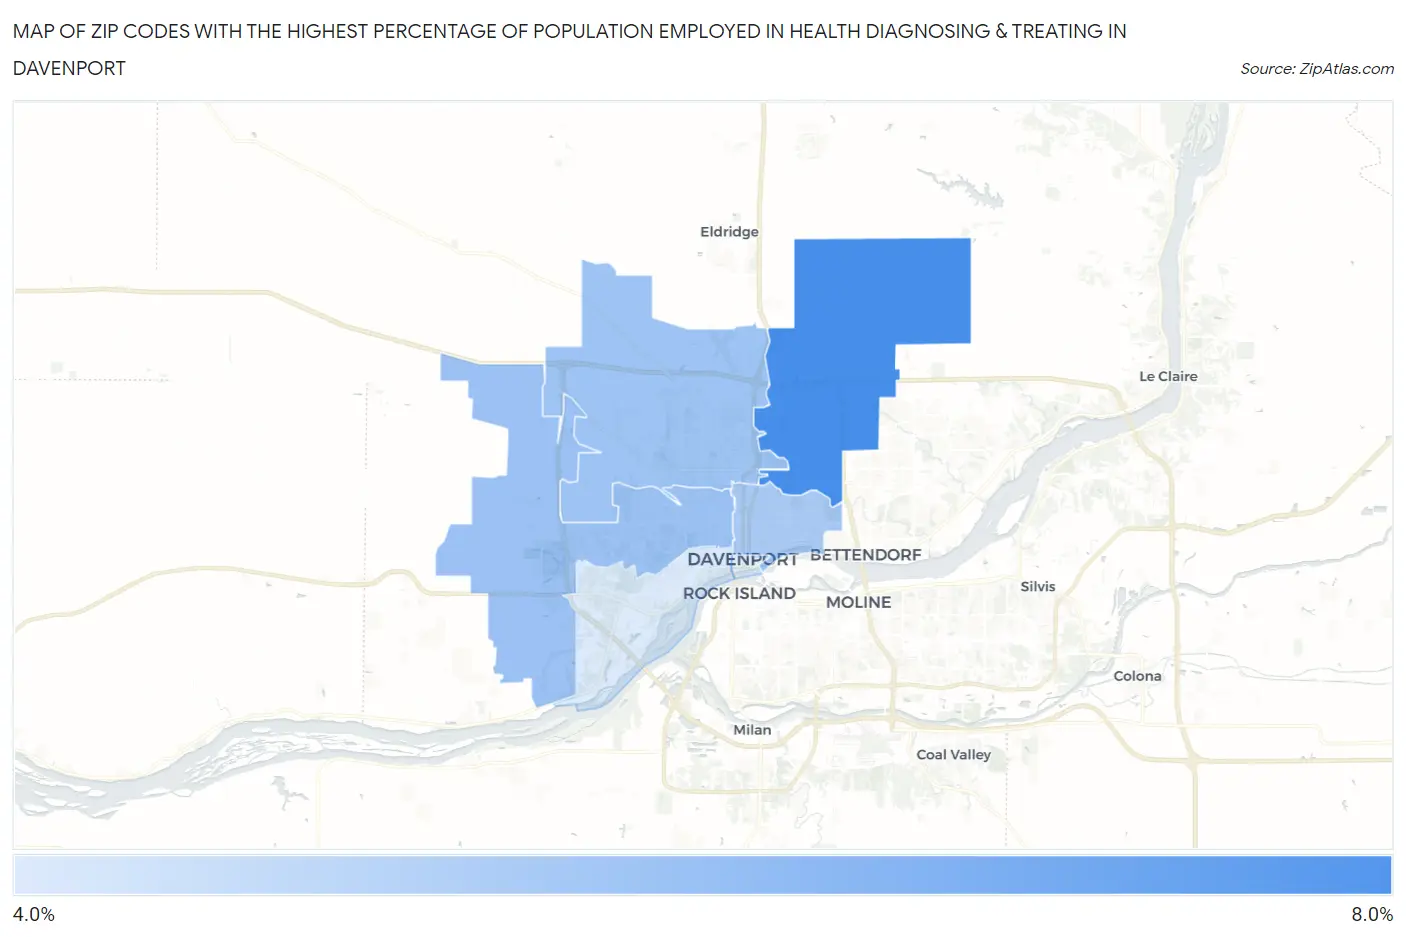
Map of Zip Codes with the Highest Percentage of Population Employed in Health Diagnosing & Treating in Davenport
0.0%
8.0%
Zip Codes with the Highest Percentage of Population Employed in Health Diagnosing & Treating in Davenport, IA
| Zip Code | % Employed | vs State | vs National | |
| 1. | 52807 | 7.2% | 6.2%(+1.05)#265 | 6.2%(+0.967)#9,683 |
| 2. | 52804 | 5.6% | 6.2%(-0.597)#417 | 6.2%(-0.677)#15,509 |
| 3. | 52806 | 5.5% | 6.2%(-0.667)#425 | 6.2%(-0.747)#15,795 |
| 4. | 52803 | 5.3% | 6.2%(-0.915)#453 | 6.2%(-0.995)#16,755 |
| 5. | 52802 | 4.3% | 6.2%(-1.90)#575 | 6.2%(-1.98)#20,470 |
1
Common Questions
What are the Top 5 Zip Codes with the Highest Percentage of Population Employed in Health Diagnosing & Treating in Davenport, IA?
Top 5 Zip Codes with the Highest Percentage of Population Employed in Health Diagnosing & Treating in Davenport, IA are:
What zip code has the Highest Percentage of Population Employed in Health Diagnosing & Treating in Davenport, IA?
52807 has the Highest Percentage of Population Employed in Health Diagnosing & Treating in Davenport, IA with 7.2%.
What is the Percentage of Population Employed in Health Diagnosing & Treating in Davenport, IA?
Percentage of Population Employed in Health Diagnosing & Treating in Davenport is 5.6%.
What is the Percentage of Population Employed in Health Diagnosing & Treating in Iowa?
Percentage of Population Employed in Health Diagnosing & Treating in Iowa is 6.2%.
What is the Percentage of Population Employed in Health Diagnosing & Treating in the United States?
Percentage of Population Employed in Health Diagnosing & Treating in the United States is 6.2%.