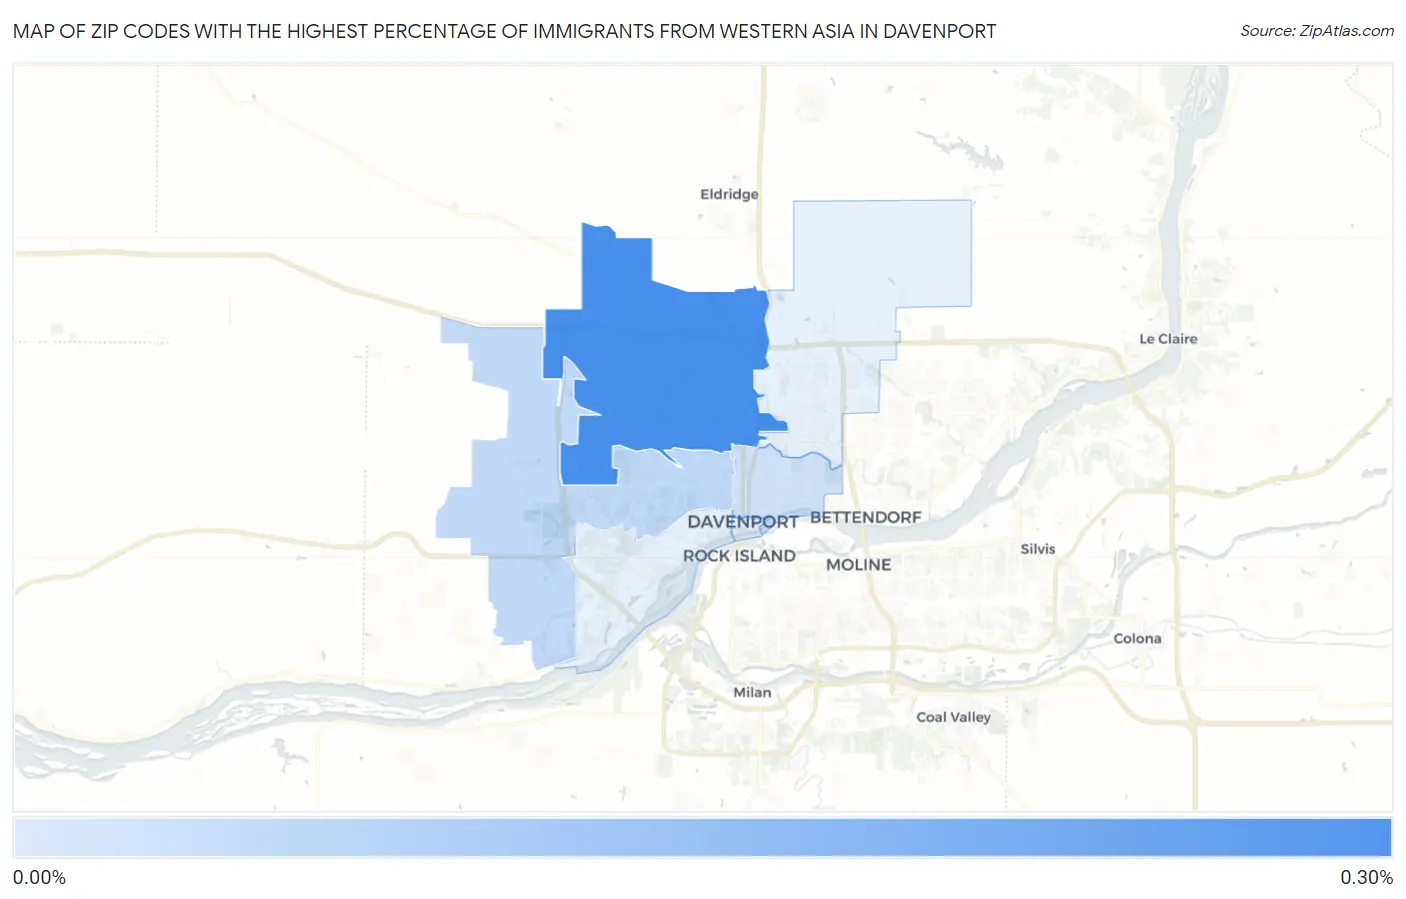
Zip Codes with the Highest Percentage of Immigrants from Western Asia in Davenport, IA
RELATED REPORTS & OPTIONS
Western Asia
Davenport
Compare Zip Codes
Map of Zip Codes with the Highest Percentage of Immigrants from Western Asia in Davenport
0.00%
0.30%
Zip Codes with the Highest Percentage of Immigrants from Western Asia in Davenport, IA
| Zip Code | Western Asia | vs State | vs National | |
| 1. | 52806 | 0.30% | 0.13%(+0.165)#-1 | 0.36%(-0.068)#0 |
| 2. | 52804 | 0.056% | 0.13%(-0.074)#0 | 0.36%(-0.308)#1 |
| 3. | 52803 | 0.023% | 0.13%(-0.107)#1 | 0.36%(-0.340)#2 |
1
Common Questions
What are the Top 5 Zip Codes with the Highest Percentage of Immigrants from Western Asia in Davenport, IA?
Top 5 Zip Codes with the Highest Percentage of Immigrants from Western Asia in Davenport, IA are:
What zip code has the Highest Percentage of Immigrants from Western Asia in Davenport, IA?
52806 has the Highest Percentage of Immigrants from Western Asia in Davenport, IA with 0.30%.
What is the Percentage of Immigrants from Western Asia in Davenport, IA?
Percentage of Immigrants from Western Asia in Davenport is 0.10%.
What is the Percentage of Immigrants from Western Asia in Iowa?
Percentage of Immigrants from Western Asia in Iowa is 0.13%.
What is the Percentage of Immigrants from Western Asia in the United States?
Percentage of Immigrants from Western Asia in the United States is 0.36%.