Zip Codes with the Highest Percentage of Immigrants from Asia in Davenport, IA
RELATED REPORTS & OPTIONS
Asia
Davenport
Compare Zip Codes
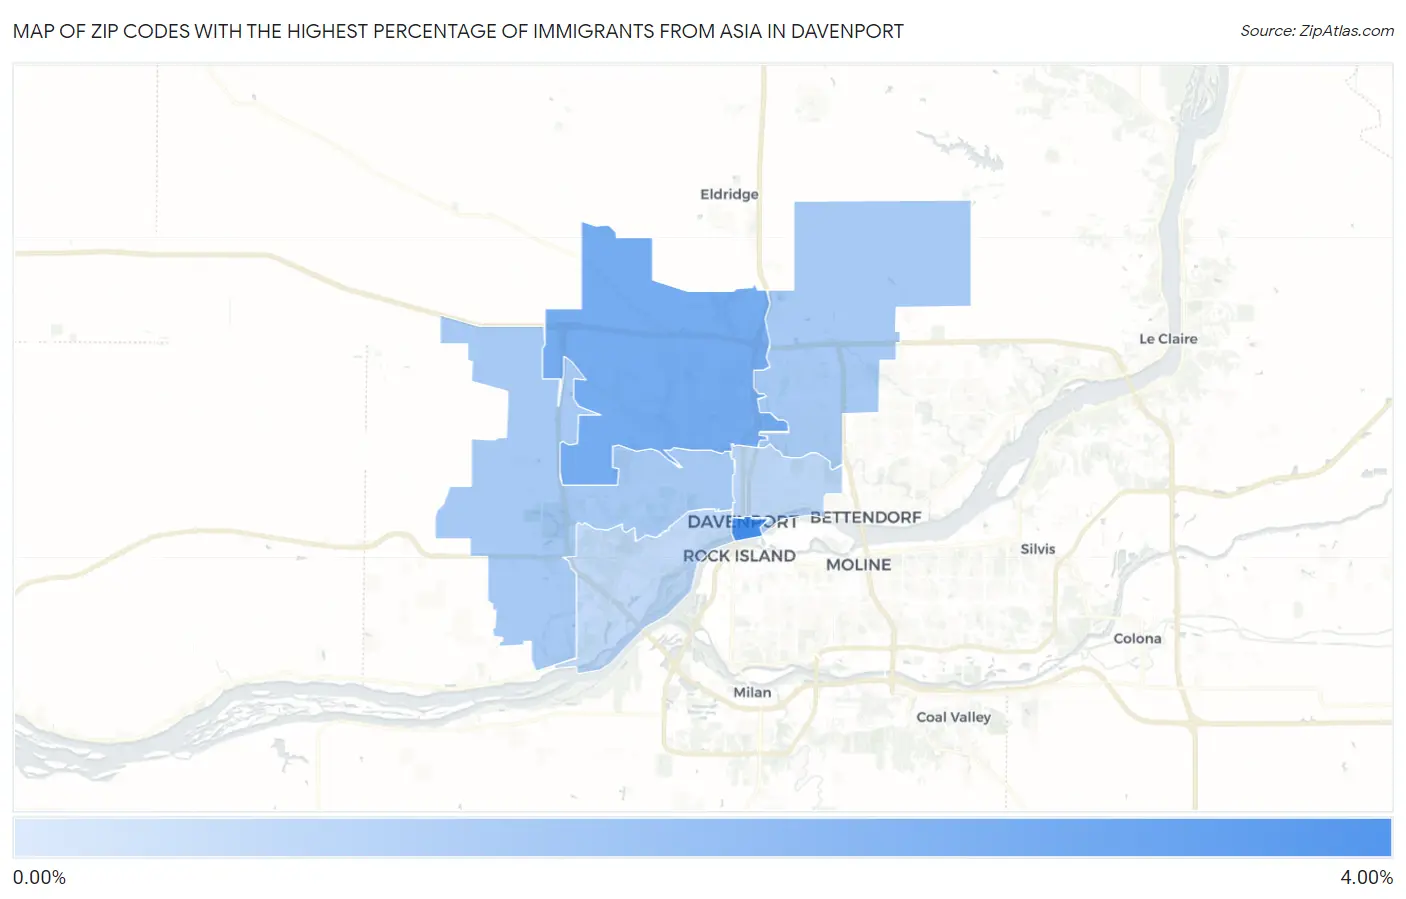
Map of Zip Codes with the Highest Percentage of Immigrants from Asia in Davenport
0.00%
4.00%
Zip Codes with the Highest Percentage of Immigrants from Asia in Davenport, IA
| Zip Code | Asia | vs State | vs National | |
| 1. | 52801 | 3.50% | 1.96%(+1.54)#51 | 4.26%(-0.756)#4,286 |
| 2. | 52806 | 2.44% | 1.96%(+0.473)#70 | 4.26%(-1.82)#5,849 |
| 3. | 52804 | 1.20% | 1.96%(-0.760)#134 | 4.26%(-3.06)#9,378 |
| 4. | 52807 | 1.20% | 1.96%(-0.762)#135 | 4.26%(-3.06)#9,391 |
| 5. | 52803 | 0.73% | 1.96%(-1.23)#189 | 4.26%(-3.53)#11,961 |
| 6. | 52802 | 0.64% | 1.96%(-1.33)#206 | 4.26%(-3.62)#12,655 |
1
Common Questions
What are the Top 5 Zip Codes with the Highest Percentage of Immigrants from Asia in Davenport, IA?
Top 5 Zip Codes with the Highest Percentage of Immigrants from Asia in Davenport, IA are:
What zip code has the Highest Percentage of Immigrants from Asia in Davenport, IA?
52801 has the Highest Percentage of Immigrants from Asia in Davenport, IA with 3.50%.
What is the Percentage of Immigrants from Asia in Davenport, IA?
Percentage of Immigrants from Asia in Davenport is 1.45%.
What is the Percentage of Immigrants from Asia in Iowa?
Percentage of Immigrants from Asia in Iowa is 1.96%.
What is the Percentage of Immigrants from Asia in the United States?
Percentage of Immigrants from Asia in the United States is 4.26%.