Zip Codes with the Highest Percentage of Self-Employed / Not Incorporated in Miami, FL

RELATED REPORTS & OPTIONS

Self-Employed / Not Incorporated
Population
Families and Households
Female Fertility
Female Fertility (Unmarried)
Race (Community Size)
Race (Percentage)
Ancestry (Community Size)
AfghanAfricanAlbanianAmericanApacheArabArgentineanArmenianAustralianAustrianBahamianBarbadianBasqueBelgianBelizeanBermudanBhutaneseBlackfeetBolivianBrazilianBritishBritish West IndianBulgarianBurmeseCanadianCelticCentral AmericanCentral American IndianCherokeeChickasawChileanChippewaChoctawColombianComancheCosta RicanCreekCroatianCubanCypriotCzechCzechoslovakianDanishDominicanDutchDutch West IndianEastern EuropeanEcuadorianEgyptianEnglishEstonianEthiopianEuropeanFilipinoFinnishFrenchFrench American IndianFrench CanadianGermanGreekGuamanian / ChamorroGuatemalanGuyaneseHaitianHonduranHungarianIcelanderIndian (Asian)IndonesianInupiatIranianIraqiIrishIroquoisIsraeliItalianJamaicanJapaneseJordanianKenyanKoreanLaotianLatvianLebaneseLithuanianMacedonianMalaysianMalteseMexicanMexican American IndianMongolianMoroccanNative HawaiianNavajoNew ZealanderNicaraguanNigerianNorthern EuropeanNorwegianPakistaniPalestinianPanamanianParaguayanPennsylvania GermanPeruvianPolishPortuguesePuerto RicanRomanianRussianSalvadoranSamoanScandinavianScotch-IrishScottishSeminoleSenegaleseSerbianSiouxSlavicSlovakSloveneSouth AfricanSouth AmericanSouth American IndianSpaniardSpanishSpanish AmericanSpanish American IndianSri LankanSubsaharan AfricanSudaneseSwedishSwissSyrianThaiTrinidadian and TobagonianTurkishU.S. Virgin IslanderUkrainianUruguayanVenezuelanVietnameseWelshWest IndianYugoslavianZimbabwean
Ancestry (Percentage)
AfghanAfricanAlbanianAmericanApacheArabArgentineanArmenianAustralianAustrianBahamianBarbadianBasqueBelgianBelizeanBermudanBhutaneseBlackfeetBolivianBrazilianBritishBritish West IndianBulgarianBurmeseCanadianCelticCentral AmericanCentral American IndianCherokeeChickasawChileanChippewaChoctawColombianComancheCosta RicanCreekCroatianCubanCypriotCzechCzechoslovakianDanishDominicanDutchDutch West IndianEastern EuropeanEcuadorianEgyptianEnglishEstonianEthiopianEuropeanFilipinoFinnishFrenchFrench American IndianFrench CanadianGermanGreekGuamanian / ChamorroGuatemalanGuyaneseHaitianHonduranHungarianIcelanderIndian (Asian)IndonesianInupiatIranianIraqiIrishIroquoisIsraeliItalianJamaicanJapaneseJordanianKenyanKoreanLaotianLatvianLebaneseLithuanianMacedonianMalaysianMalteseMexicanMexican American IndianMongolianMoroccanNative HawaiianNavajoNew ZealanderNicaraguanNigerianNorthern EuropeanNorwegianPakistaniPalestinianPanamanianParaguayanPennsylvania GermanPeruvianPolishPortuguesePuerto RicanRomanianRussianSalvadoranSamoanScandinavianScotch-IrishScottishSeminoleSenegaleseSerbianSiouxSlavicSlovakSloveneSouth AfricanSouth AmericanSouth American IndianSpaniardSpanishSpanish AmericanSpanish American IndianSri LankanSubsaharan AfricanSudaneseSwedishSwissSyrianThaiTrinidadian and TobagonianTurkishU.S. Virgin IslanderUkrainianUruguayanVenezuelanVietnameseWelshWest IndianYugoslavianZimbabwean
Immigrant Origin (Total)
AfghanistanAfricaAlbaniaArgentinaArmeniaAsiaAustraliaAustriaBahamasBangladeshBarbadosBelarusBelgiumBelizeBoliviaBosnia and HerzegovinaBrazilBulgariaBurma / MyanmarCambodiaCameroonCanadaCaribbeanCentral AmericaChileChinaColombiaCosta RicaCroatiaCubaCzechoslovakiaDenmarkDominicaDominican RepublicEastern AfricaEastern AsiaEastern EuropeEcuadorEgyptEl SalvadorEnglandEthiopiaEuropeFranceGermanyGreeceGrenadaGuatemalaGuyanaHaitiHondurasHong KongHungaryIndiaIndonesiaIranIraqIrelandIsraelItalyJamaicaJapanJordanKazakhstanKenyaKoreaKuwaitLaosLatin AmericaLatviaLebanonLithuaniaMalaysiaMexicoMiddle AfricaMoldovaMoroccoNepalNetherlandsNicaraguaNigeriaNorthern AfricaNorthern EuropeNorwayOceaniaPakistanPanamaPeruPhilippinesPolandPortugalRomaniaRussiaSaudi ArabiaScotlandSerbiaSingaporeSouth AfricaSouth AmericaSouth Central AsiaSouth Eastern AsiaSouthern EuropeSpainSri LankaSt. Vincent and the GrenadinesSudanSwedenSwitzerlandSyriaTaiwanThailandTrinidad and TobagoTurkeyUgandaUkraineUruguayUzbekistanVenezuelaVietnamWest IndiesWestern AfricaWestern AsiaWestern EuropeZaireZimbabwe
Immigrant Origin (Percentage)
AfghanistanAfricaAlbaniaArgentinaArmeniaAsiaAustraliaAustriaBahamasBangladeshBarbadosBelarusBelgiumBelizeBoliviaBosnia and HerzegovinaBrazilBulgariaBurma / MyanmarCambodiaCameroonCanadaCaribbeanCentral AmericaChileChinaColombiaCosta RicaCroatiaCubaCzechoslovakiaDenmarkDominicaDominican RepublicEastern AfricaEastern AsiaEastern EuropeEcuadorEgyptEl SalvadorEnglandEthiopiaEuropeFranceGermanyGreeceGrenadaGuatemalaGuyanaHaitiHondurasHong KongHungaryIndiaIndonesiaIranIraqIrelandIsraelItalyJamaicaJapanJordanKazakhstanKenyaKoreaKuwaitLaosLatin AmericaLatviaLebanonLithuaniaMalaysiaMexicoMiddle AfricaMoldovaMoroccoNepalNetherlandsNicaraguaNigeriaNorthern AfricaNorthern EuropeNorwayOceaniaPakistanPanamaPeruPhilippinesPolandPortugalRomaniaRussiaSaudi ArabiaScotlandSerbiaSingaporeSouth AfricaSouth AmericaSouth Central AsiaSouth Eastern AsiaSouthern EuropeSpainSri LankaSt. Vincent and the GrenadinesSudanSwedenSwitzerlandSyriaTaiwanThailandTrinidad and TobagoTurkeyUgandaUkraineUruguayUzbekistanVenezuelaVietnamWest IndiesWestern AfricaWestern AsiaWestern EuropeZaireZimbabwe
Income
Income (Families)
Income (Households)
Poverty
Poverty (Families)
Unemployment
Employment Occupations
Employment Industries
Employer Class
Commute Time
Commute Means
School Enrollment
Education by Degree Field
Occupancy
Finances
Physical Characteristics
Miami
States
Florida Cities
Altamonte SpringsApopkaArcadiaBoca RatonBonita SpringsBoynton BeachBradentonBrandonBrooksvilleCape CoralCasselberryClearwaterClermontCocoaCoral SpringsCrestviewCrystal RiverDade CityDavenportDaytona BeachDeerfield BeachDefuniak SpringsDelandDelray BeachDeltonaDunnellonEdgewaterEnglewoodEustisFort LauderdaleFort MyersFort PierceFort Walton BeachGainesvilleGulf BreezeHialeahHolidayHollywoodHomesteadHomosassaHudsonInvernessJacksonvilleJupiterKissimmeeLake CityLake WalesLake WorthLakelandLand O LakesLargoLeesburgLehigh AcresLive OakLongwoodLutzMariannaMelbourneMerritt IslandMiamiMiami BeachMiltonNaplesNew Port RicheyNew Smyrna BeachNorth Fort MyersNorth PortOcalaOkeechobeeOpa LockaOrange ParkOrlandoOrmond BeachOviedoPalm BayPalm Beach GardensPalm CoastPalm HarborPanama CityPanama City BeachPensacolaPerryPinellas ParkPlant CityPompano BeachPort CharlottePort OrangePort Saint LuciePunta GordaQuincyRiverviewSaint AugustineSaint CloudSaint PetersburgSanfordSarasotaSebastianSebringSeminoleSpring HillStuartTallahasseeTampaTarpon SpringsThe VillagesTitusvilleValricoVeniceVero BeachWesley ChapelWest Palm BeachWewahitchkaWinter HavenWinter ParkZephyrhills
Compare Zip Codes
Comparison Subject

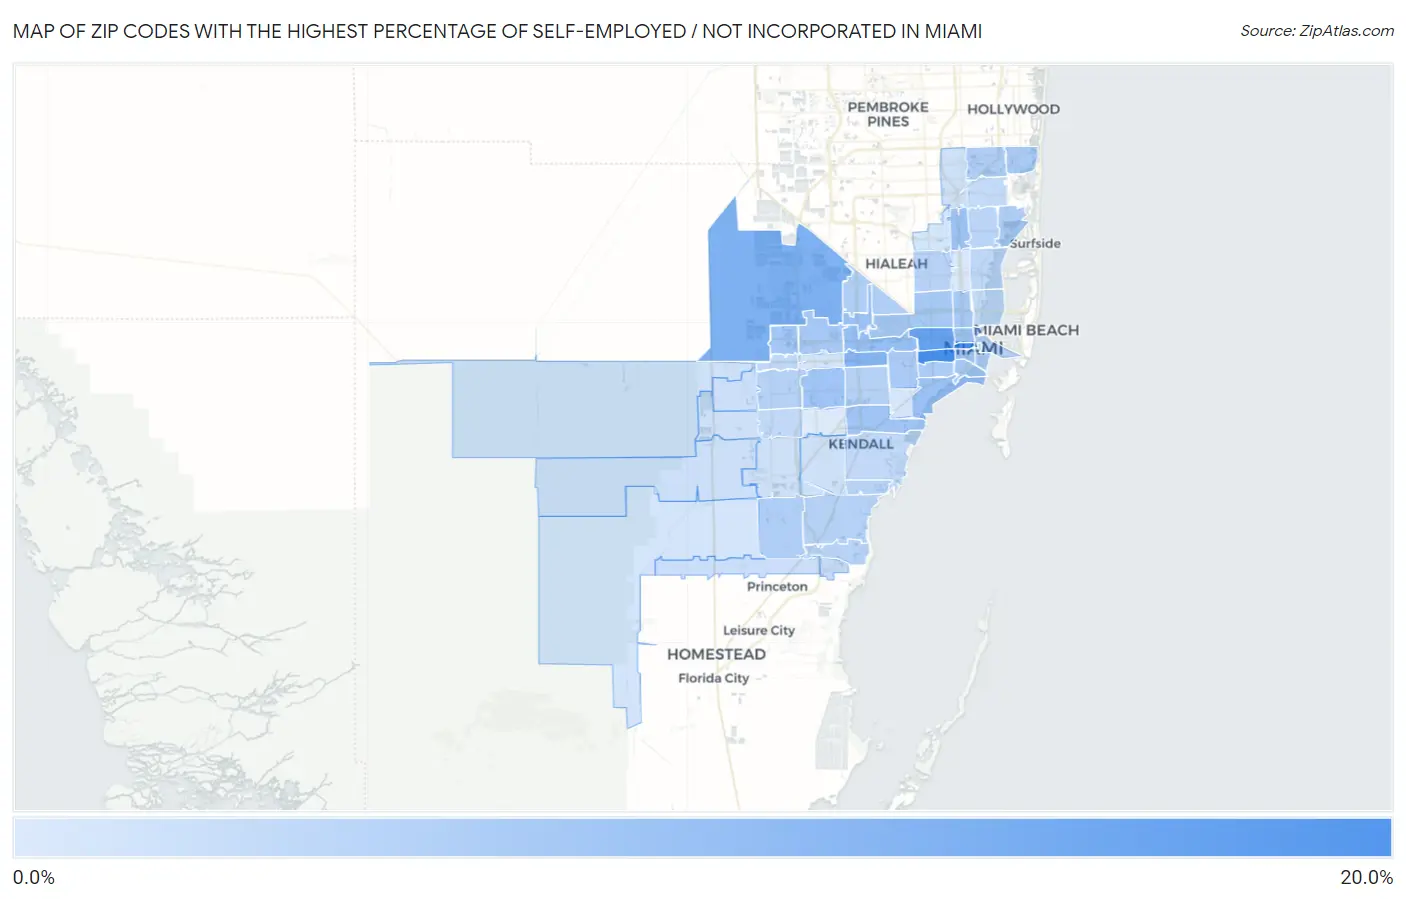
Map of Zip Codes with the Highest Percentage of Self-Employed / Not Incorporated in Miami

0.0%
20.0%
Zip Codes with the Highest Percentage of Self-Employed / Not Incorporated in Miami Map

Zip Codes with the Highest Percentage of Self-Employed / Not Incorporated in Miami, FL

Zip Code % Self-Employed / Not Incorporated vs State vs National
1.3313518.6%6.1%(+12.5)#145.8%(+12.8)#2,147
2.3312817.8%6.1%(+11.7)#165.8%(+12.0)#2,382
3.3312515.5%6.1%(+9.43)#245.8%(+9.70)#3,190
4.3317812.9%6.1%(+6.79)#425.8%(+7.06)#4,602
5.3314412.1%6.1%(+6.01)#555.8%(+6.28)#5,209
6.3312610.3%6.1%(+4.17)#955.8%(+4.44)#7,058
7.3312210.2%6.1%(+4.13)#965.8%(+4.41)#7,099
8.3316810.2%6.1%(+4.07)#985.8%(+4.34)#7,168
9.3313610.0%6.1%(+3.90)#1025.8%(+4.17)#7,382
10.3313310.0%6.1%(+3.88)#1035.8%(+4.15)#7,402
11.331309.6%6.1%(+3.56)#1155.8%(+3.83)#7,829
12.331439.4%6.1%(+3.34)#1315.8%(+3.61)#8,116
13.331659.4%6.1%(+3.29)#1365.8%(+3.56)#8,202
14.331829.2%6.1%(+3.09)#1465.8%(+3.36)#8,493
15.331729.1%6.1%(+3.00)#1545.8%(+3.27)#8,652
16.331298.8%6.1%(+2.69)#1685.8%(+2.97)#9,174
17.331278.8%6.1%(+2.67)#1705.8%(+2.95)#9,217
18.331428.7%6.1%(+2.64)#1735.8%(+2.92)#9,270
19.331348.6%6.1%(+2.50)#1815.8%(+2.77)#9,490
20.331808.6%6.1%(+2.48)#1825.8%(+2.75)#9,530
21.331458.4%6.1%(+2.33)#1875.8%(+2.60)#9,809
22.331798.2%6.1%(+2.09)#1995.8%(+2.37)#10,287
23.331818.1%6.1%(+2.05)#2035.8%(+2.33)#10,362
24.331667.9%6.1%(+1.80)#2315.8%(+2.07)#10,871
25.331777.8%6.1%(+1.74)#2325.8%(+2.01)#11,015
26.331557.5%6.1%(+1.40)#2605.8%(+1.67)#11,823
27.331757.4%6.1%(+1.36)#2635.8%(+1.63)#11,898
28.331317.4%6.1%(+1.34)#2655.8%(+1.62)#11,934
29.331577.4%6.1%(+1.32)#2675.8%(+1.59)#12,026
30.331587.4%6.1%(+1.28)#2735.8%(+1.56)#12,120
31.331477.3%6.1%(+1.18)#2845.8%(+1.45)#12,353
32.331897.2%6.1%(+1.16)#2855.8%(+1.43)#12,398
33.331327.2%6.1%(+1.16)#2865.8%(+1.43)#12,400
34.331616.9%6.1%(+0.854)#3195.8%(+1.13)#13,202
35.331846.6%6.1%(+0.500)#3615.8%(+0.774)#14,165
36.331386.6%6.1%(+0.474)#3635.8%(+0.748)#14,261
37.331566.4%6.1%(+0.348)#3785.8%(+0.621)#14,664
38.331836.3%6.1%(+0.180)#4085.8%(+0.454)#15,193
39.331376.2%6.1%(+0.156)#4105.8%(+0.429)#15,275
40.331626.2%6.1%(+0.095)#4225.8%(+0.369)#15,469
41.331905.9%6.1%(-0.186)#4565.8%(+0.087)#16,379
42.331705.6%6.1%(-0.539)#5135.8%(-0.265)#17,612
43.331855.3%6.1%(-0.818)#5565.8%(-0.544)#18,619
44.331965.2%6.1%(-0.889)#5665.8%(-0.615)#18,920
45.331945.1%6.1%(-0.957)#5825.8%(-0.684)#19,179
46.331935.1%6.1%(-1.00)#5955.8%(-0.727)#19,325
47.331865.1%6.1%(-1.03)#6025.8%(-0.755)#19,435
48.331695.0%6.1%(-1.05)#6045.8%(-0.779)#19,526
49.331765.0%6.1%(-1.08)#6075.8%(-0.805)#19,630
50.331874.7%6.1%(-1.37)#6545.8%(-1.10)#20,725
51.331674.5%6.1%(-1.56)#6865.8%(-1.29)#21,465
52.331744.5%6.1%(-1.56)#6885.8%(-1.29)#21,474
53.331464.4%6.1%(-1.71)#7075.8%(-1.44)#22,041
54.331503.9%6.1%(-2.15)#7765.8%(-1.88)#23,602
55.331733.8%6.1%(-2.33)#7995.8%(-2.05)#24,191

Common Questions

What are the Top 10 Zip Codes with the Highest Percentage of Self-Employed / Not Incorporated in Miami, FL?
Top 10 Zip Codes with the Highest Percentage of Self-Employed / Not Incorporated in Miami, FL are:
#1
18.6%
#2
17.8%
#3
15.5%
#4
12.9%
#5
12.1%
#6
10.3%
#7
10.2%
#8
10.2%
#9
10.0%
#10
10.0%
What zip code has the Highest Percentage of Self-Employed / Not Incorporated in Miami, FL?
33135 has the Highest Percentage of Self-Employed / Not Incorporated in Miami, FL with 18.6%.
What is the Percentage of Self-Employed / Not Incorporated in Miami, FL?
Percentage of Self-Employed / Not Incorporated in Miami is 10.5%.
What is the Percentage of Self-Employed / Not Incorporated in Florida?
Percentage of Self-Employed / Not Incorporated in Florida is 6.1%.
What is the Percentage of Self-Employed / Not Incorporated in the United States?
Percentage of Self-Employed / Not Incorporated in the United States is 5.8%.