Zip Codes with the Highest Poverty Level Among Children Under the Age of 16 in Miami, FL

RELATED REPORTS & OPTIONS

Highest Poverty | Child 0-16
Population
Families and Households
Female Fertility
Female Fertility (Unmarried)
Race (Community Size)
Race (Percentage)
Ancestry (Community Size)
AfghanAfricanAlbanianAmericanApacheArabArgentineanArmenianAustralianAustrianBahamianBarbadianBasqueBelgianBelizeanBermudanBhutaneseBlackfeetBolivianBrazilianBritishBritish West IndianBulgarianBurmeseCanadianCelticCentral AmericanCentral American IndianCherokeeChickasawChileanChippewaChoctawColombianComancheCosta RicanCreekCroatianCubanCypriotCzechCzechoslovakianDanishDominicanDutchDutch West IndianEastern EuropeanEcuadorianEgyptianEnglishEstonianEthiopianEuropeanFilipinoFinnishFrenchFrench American IndianFrench CanadianGermanGreekGuamanian / ChamorroGuatemalanGuyaneseHaitianHonduranHungarianIcelanderIndian (Asian)IndonesianInupiatIranianIraqiIrishIroquoisIsraeliItalianJamaicanJapaneseJordanianKenyanKoreanLaotianLatvianLebaneseLithuanianMacedonianMalaysianMalteseMexicanMexican American IndianMongolianMoroccanNative HawaiianNavajoNew ZealanderNicaraguanNigerianNorthern EuropeanNorwegianPakistaniPalestinianPanamanianParaguayanPennsylvania GermanPeruvianPolishPortuguesePuerto RicanRomanianRussianSalvadoranSamoanScandinavianScotch-IrishScottishSeminoleSenegaleseSerbianSiouxSlavicSlovakSloveneSouth AfricanSouth AmericanSouth American IndianSpaniardSpanishSpanish AmericanSpanish American IndianSri LankanSubsaharan AfricanSudaneseSwedishSwissSyrianThaiTrinidadian and TobagonianTurkishU.S. Virgin IslanderUkrainianUruguayanVenezuelanVietnameseWelshWest IndianYugoslavianZimbabwean
Ancestry (Percentage)
AfghanAfricanAlbanianAmericanApacheArabArgentineanArmenianAustralianAustrianBahamianBarbadianBasqueBelgianBelizeanBermudanBhutaneseBlackfeetBolivianBrazilianBritishBritish West IndianBulgarianBurmeseCanadianCelticCentral AmericanCentral American IndianCherokeeChickasawChileanChippewaChoctawColombianComancheCosta RicanCreekCroatianCubanCypriotCzechCzechoslovakianDanishDominicanDutchDutch West IndianEastern EuropeanEcuadorianEgyptianEnglishEstonianEthiopianEuropeanFilipinoFinnishFrenchFrench American IndianFrench CanadianGermanGreekGuamanian / ChamorroGuatemalanGuyaneseHaitianHonduranHungarianIcelanderIndian (Asian)IndonesianInupiatIranianIraqiIrishIroquoisIsraeliItalianJamaicanJapaneseJordanianKenyanKoreanLaotianLatvianLebaneseLithuanianMacedonianMalaysianMalteseMexicanMexican American IndianMongolianMoroccanNative HawaiianNavajoNew ZealanderNicaraguanNigerianNorthern EuropeanNorwegianPakistaniPalestinianPanamanianParaguayanPennsylvania GermanPeruvianPolishPortuguesePuerto RicanRomanianRussianSalvadoranSamoanScandinavianScotch-IrishScottishSeminoleSenegaleseSerbianSiouxSlavicSlovakSloveneSouth AfricanSouth AmericanSouth American IndianSpaniardSpanishSpanish AmericanSpanish American IndianSri LankanSubsaharan AfricanSudaneseSwedishSwissSyrianThaiTrinidadian and TobagonianTurkishU.S. Virgin IslanderUkrainianUruguayanVenezuelanVietnameseWelshWest IndianYugoslavianZimbabwean
Immigrant Origin (Total)
AfghanistanAfricaAlbaniaArgentinaArmeniaAsiaAustraliaAustriaBahamasBangladeshBarbadosBelarusBelgiumBelizeBoliviaBosnia and HerzegovinaBrazilBulgariaBurma / MyanmarCambodiaCameroonCanadaCaribbeanCentral AmericaChileChinaColombiaCosta RicaCroatiaCubaCzechoslovakiaDenmarkDominicaDominican RepublicEastern AfricaEastern AsiaEastern EuropeEcuadorEgyptEl SalvadorEnglandEthiopiaEuropeFranceGermanyGreeceGrenadaGuatemalaGuyanaHaitiHondurasHong KongHungaryIndiaIndonesiaIranIraqIrelandIsraelItalyJamaicaJapanJordanKazakhstanKenyaKoreaKuwaitLaosLatin AmericaLatviaLebanonLithuaniaMalaysiaMexicoMiddle AfricaMoldovaMoroccoNepalNetherlandsNicaraguaNigeriaNorthern AfricaNorthern EuropeNorwayOceaniaPakistanPanamaPeruPhilippinesPolandPortugalRomaniaRussiaSaudi ArabiaScotlandSerbiaSingaporeSouth AfricaSouth AmericaSouth Central AsiaSouth Eastern AsiaSouthern EuropeSpainSri LankaSt. Vincent and the GrenadinesSudanSwedenSwitzerlandSyriaTaiwanThailandTrinidad and TobagoTurkeyUgandaUkraineUruguayUzbekistanVenezuelaVietnamWest IndiesWestern AfricaWestern AsiaWestern EuropeZaireZimbabwe
Immigrant Origin (Percentage)
AfghanistanAfricaAlbaniaArgentinaArmeniaAsiaAustraliaAustriaBahamasBangladeshBarbadosBelarusBelgiumBelizeBoliviaBosnia and HerzegovinaBrazilBulgariaBurma / MyanmarCambodiaCameroonCanadaCaribbeanCentral AmericaChileChinaColombiaCosta RicaCroatiaCubaCzechoslovakiaDenmarkDominicaDominican RepublicEastern AfricaEastern AsiaEastern EuropeEcuadorEgyptEl SalvadorEnglandEthiopiaEuropeFranceGermanyGreeceGrenadaGuatemalaGuyanaHaitiHondurasHong KongHungaryIndiaIndonesiaIranIraqIrelandIsraelItalyJamaicaJapanJordanKazakhstanKenyaKoreaKuwaitLaosLatin AmericaLatviaLebanonLithuaniaMalaysiaMexicoMiddle AfricaMoldovaMoroccoNepalNetherlandsNicaraguaNigeriaNorthern AfricaNorthern EuropeNorwayOceaniaPakistanPanamaPeruPhilippinesPolandPortugalRomaniaRussiaSaudi ArabiaScotlandSerbiaSingaporeSouth AfricaSouth AmericaSouth Central AsiaSouth Eastern AsiaSouthern EuropeSpainSri LankaSt. Vincent and the GrenadinesSudanSwedenSwitzerlandSyriaTaiwanThailandTrinidad and TobagoTurkeyUgandaUkraineUruguayUzbekistanVenezuelaVietnamWest IndiesWestern AfricaWestern AsiaWestern EuropeZaireZimbabwe
Income
Income (Families)
Income (Households)
Poverty
Poverty (Families)
Unemployment
Employment Occupations
Employment Industries
Employer Class
Commute Time
Commute Means
School Enrollment
Education by Degree Field
Occupancy
Finances
Physical Characteristics
Miami
States
Florida Cities
Altamonte SpringsApopkaArcadiaBoca RatonBonita SpringsBoynton BeachBradentonBrandonBrooksvilleCape CoralCasselberryClearwaterClermontCocoaCoral SpringsCrestviewCrystal RiverDade CityDavenportDaytona BeachDeerfield BeachDefuniak SpringsDelandDelray BeachDeltonaDunnellonEdgewaterEnglewoodEustisFort LauderdaleFort MyersFort PierceFort Walton BeachGainesvilleGulf BreezeHialeahHolidayHollywoodHomesteadHomosassaHudsonInvernessJacksonvilleJupiterKissimmeeLake CityLake WalesLake WorthLakelandLand O LakesLargoLeesburgLehigh AcresLive OakLongwoodLutzMariannaMelbourneMerritt IslandMiamiMiami BeachMiltonNaplesNew Port RicheyNew Smyrna BeachNorth Fort MyersNorth PortOcalaOkeechobeeOpa LockaOrange ParkOrlandoOrmond BeachOviedoPalm BayPalm Beach GardensPalm CoastPalm HarborPanama CityPanama City BeachPensacolaPerryPinellas ParkPlant CityPompano BeachPort CharlottePort OrangePort Saint LuciePunta GordaQuincyRiverviewSaint AugustineSaint CloudSaint PetersburgSanfordSarasotaSebastianSebringSeminoleSpring HillStuartTallahasseeTampaTarpon SpringsTitusvilleValricoVeniceVero BeachWesley ChapelWest Palm BeachWewahitchkaWinter HavenWinter ParkZephyrhills
Compare Zip Codes
Comparison Subject

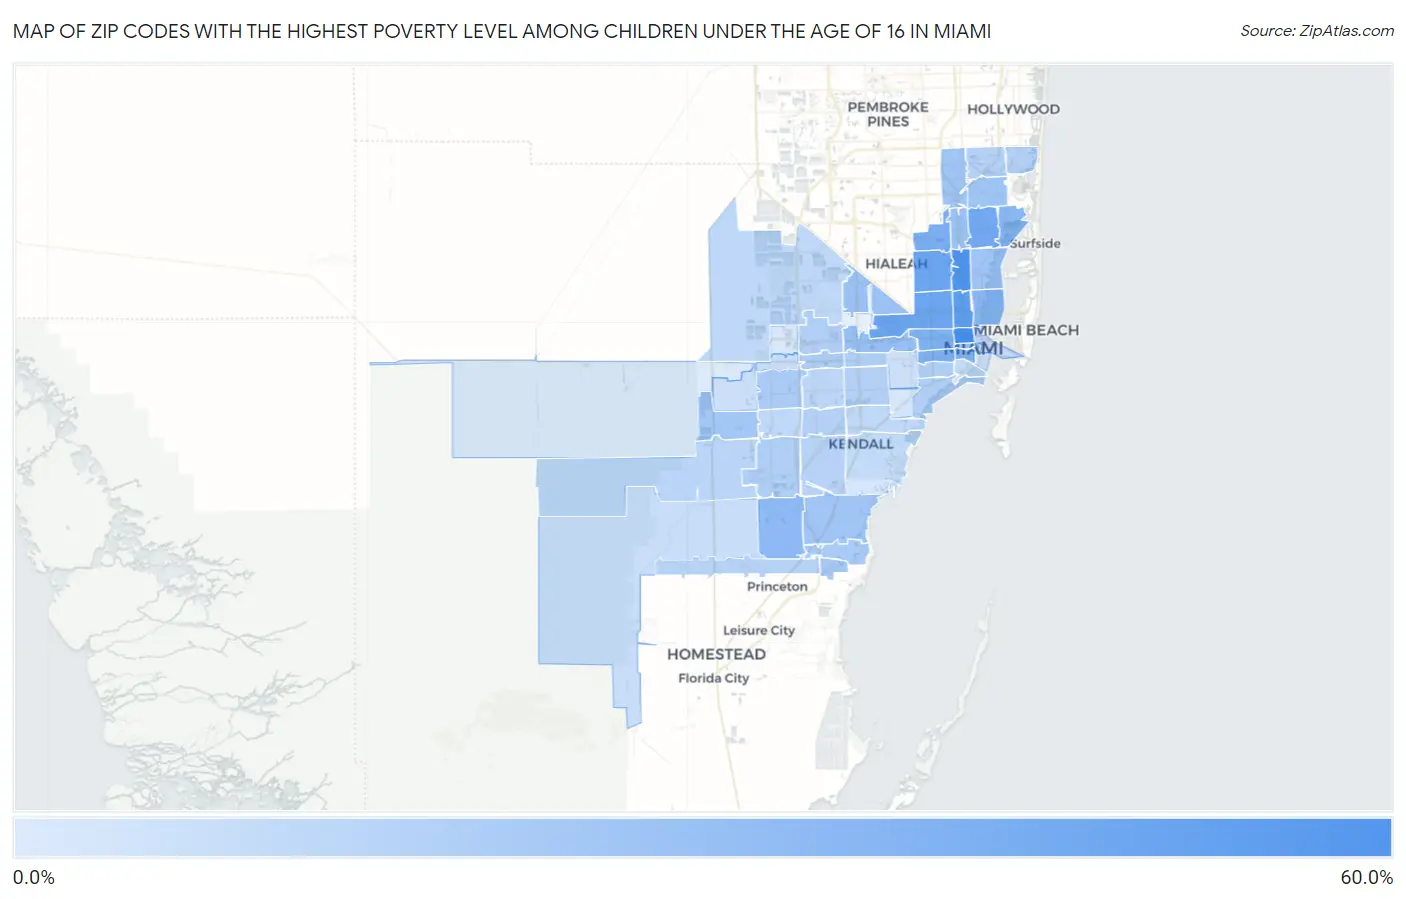
Map of Zip Codes with the Highest Poverty Level Among Children Under the Age of 16 in Miami

0.0%
60.0%
Zip Codes with the Highest Poverty Level Among Children Under the Age of 16 in Miami Map

Zip Codes with the Highest Poverty Level Among Children Under the Age of 16 in Miami, FL

Zip Code Child Poverty vs State vs National
1.3313651.3%17.9%(+33.4)#2516.9%(+34.3)#1,713
2.3315047.4%17.9%(+29.5)#4316.9%(+30.4)#2,107
3.3312741.7%17.9%(+23.7)#6416.9%(+24.7)#2,891
4.3314736.9%17.9%(+19.0)#8816.9%(+20.0)#3,766
5.3314235.5%17.9%(+17.6)#9716.9%(+18.6)#4,068
6.3316134.7%17.9%(+16.7)#10416.9%(+17.7)#4,291
7.3316732.0%17.9%(+14.1)#13316.9%(+15.1)#4,993
8.3313530.7%17.9%(+12.8)#14316.9%(+13.8)#5,382
9.3312530.2%17.9%(+12.3)#15416.9%(+13.3)#5,530
10.3313028.5%17.9%(+10.6)#18116.9%(+11.6)#6,112
11.3318125.9%17.9%(+7.99)#22116.9%(+8.97)#7,184
12.3313725.5%17.9%(+7.64)#23116.9%(+8.61)#7,336
13.3317724.0%17.9%(+6.06)#26716.9%(+7.03)#8,073
14.3312621.0%17.9%(+3.09)#32616.9%(+4.07)#9,547
15.3316820.8%17.9%(+2.84)#32916.9%(+3.82)#9,695
16.3316619.6%17.9%(+1.72)#35016.9%(+2.69)#10,328
17.3316219.2%17.9%(+1.25)#36016.9%(+2.22)#10,594
18.3316918.3%17.9%(+0.393)#38716.9%(+1.37)#11,100
19.3312818.1%17.9%(+0.229)#39016.9%(+1.20)#11,194
20.3313818.1%17.9%(+0.150)#39416.9%(+1.12)#11,237
21.3315718.0%17.9%(+0.075)#39516.9%(+1.05)#11,291
22.3319317.2%17.9%(-0.731)#41716.9%(+0.241)#11,813
23.3319015.7%17.9%(-2.17)#45116.9%(-1.20)#12,834
24.3317515.6%17.9%(-2.34)#45816.9%(-1.37)#12,947
25.3318915.0%17.9%(-2.92)#47816.9%(-1.95)#13,336
26.3317414.7%17.9%(-3.24)#48816.9%(-2.27)#13,559
27.3314514.0%17.9%(-3.95)#51816.9%(-2.97)#14,059
28.3314413.6%17.9%(-4.27)#52816.9%(-3.30)#14,328
29.3318613.1%17.9%(-4.83)#54416.9%(-3.86)#14,739
30.3313312.8%17.9%(-5.06)#55216.9%(-4.09)#14,922
31.3317212.8%17.9%(-5.13)#55316.9%(-4.15)#14,962
32.3315512.7%17.9%(-5.20)#55516.9%(-4.23)#15,022
33.3318012.6%17.9%(-5.31)#56316.9%(-4.33)#15,124
34.3317312.2%17.9%(-5.70)#57616.9%(-4.72)#15,439
35.3317011.9%17.9%(-5.98)#58616.9%(-5.01)#15,673
36.3317911.5%17.9%(-6.38)#59816.9%(-5.40)#16,016
37.3317611.1%17.9%(-6.85)#61516.9%(-5.87)#16,419
38.3319610.1%17.9%(-7.79)#64716.9%(-6.81)#17,205
39.331659.7%17.9%(-8.24)#65816.9%(-7.27)#17,620
40.331789.2%17.9%(-8.71)#67716.9%(-7.74)#18,071
41.331839.0%17.9%(-8.93)#68216.9%(-7.95)#18,236
42.331438.7%17.9%(-9.16)#69016.9%(-8.19)#18,439
43.331297.7%17.9%(-10.2)#72716.9%(-9.25)#19,352
44.331567.5%17.9%(-10.4)#73416.9%(-9.41)#19,510
45.331846.4%17.9%(-11.5)#76516.9%(-10.6)#20,671
46.331876.3%17.9%(-11.6)#76716.9%(-10.6)#20,719
47.331325.9%17.9%(-12.0)#77316.9%(-11.0)#21,088
48.331345.0%17.9%(-13.0)#79816.9%(-12.0)#22,077
49.331854.9%17.9%(-13.0)#80116.9%(-12.1)#22,147
50.331582.3%17.9%(-15.6)#86016.9%(-14.7)#24,609
51.331461.9%17.9%(-16.0)#86916.9%(-15.0)#24,887
52.331821.1%17.9%(-16.8)#88516.9%(-15.8)#25,540
53.331940.61%17.9%(-17.3)#88916.9%(-16.3)#25,871
54.331310.32%17.9%(-17.6)#89416.9%(-16.6)#26,010

Common Questions

What are the Top 10 Zip Codes with the Highest Poverty Level Among Children Under the Age of 16 in Miami, FL?
Top 10 Zip Codes with the Highest Poverty Level Among Children Under the Age of 16 in Miami, FL are:
#1
51.3%
#2
47.4%
#3
41.7%
#4
36.9%
#5
35.5%
#6
34.7%
#7
32.0%
#8
30.7%
#9
30.2%
#10
28.5%
What zip code has the Highest Poverty Level Among Children Under the Age of 16 in Miami, FL?
33136 has the Highest Poverty Level Among Children Under the Age of 16 in Miami, FL with 51.3%.
What is the Poverty Level Among Children Under the Age of 16 in Miami, FL?
Poverty Level Among Children Under the Age of 16 in Miami is 25.7%.
What is the Poverty Level Among Children Under the Age of 16 in Florida?
Poverty Level Among Children Under the Age of 16 in Florida is 17.9%.
What is the Poverty Level Among Children Under the Age of 16 in the United States?
Poverty Level Among Children Under the Age of 16 in the United States is 16.9%.