Zip Codes with the Highest Percentage of Population Employed in Installation, Maintenance & Repair in Miami, FL

RELATED REPORTS & OPTIONS

Installation, Maintenance & Repair
Population
Families and Households
Female Fertility
Female Fertility (Unmarried)
Race (Community Size)
Race (Percentage)
Ancestry (Community Size)
AfghanAfricanAlbanianAmericanApacheArabArgentineanArmenianAustralianAustrianBahamianBarbadianBasqueBelgianBelizeanBermudanBhutaneseBlackfeetBolivianBrazilianBritishBritish West IndianBulgarianBurmeseCanadianCelticCentral AmericanCentral American IndianCherokeeChickasawChileanChippewaChoctawColombianComancheCosta RicanCreekCroatianCubanCypriotCzechCzechoslovakianDanishDominicanDutchDutch West IndianEastern EuropeanEcuadorianEgyptianEnglishEstonianEthiopianEuropeanFilipinoFinnishFrenchFrench American IndianFrench CanadianGermanGreekGuamanian / ChamorroGuatemalanGuyaneseHaitianHonduranHungarianIcelanderIndian (Asian)IndonesianInupiatIranianIraqiIrishIroquoisIsraeliItalianJamaicanJapaneseJordanianKenyanKoreanLaotianLatvianLebaneseLithuanianMacedonianMalaysianMalteseMexicanMexican American IndianMongolianMoroccanNative HawaiianNavajoNew ZealanderNicaraguanNigerianNorthern EuropeanNorwegianPakistaniPalestinianPanamanianParaguayanPennsylvania GermanPeruvianPolishPortuguesePuerto RicanRomanianRussianSalvadoranSamoanScandinavianScotch-IrishScottishSeminoleSenegaleseSerbianSiouxSlavicSlovakSloveneSouth AfricanSouth AmericanSouth American IndianSpaniardSpanishSpanish AmericanSpanish American IndianSri LankanSubsaharan AfricanSudaneseSwedishSwissSyrianThaiTrinidadian and TobagonianTurkishU.S. Virgin IslanderUkrainianUruguayanVenezuelanVietnameseWelshWest IndianYugoslavianZimbabwean
Ancestry (Percentage)
AfghanAfricanAlbanianAmericanApacheArabArgentineanArmenianAustralianAustrianBahamianBarbadianBasqueBelgianBelizeanBermudanBhutaneseBlackfeetBolivianBrazilianBritishBritish West IndianBulgarianBurmeseCanadianCelticCentral AmericanCentral American IndianCherokeeChickasawChileanChippewaChoctawColombianComancheCosta RicanCreekCroatianCubanCypriotCzechCzechoslovakianDanishDominicanDutchDutch West IndianEastern EuropeanEcuadorianEgyptianEnglishEstonianEthiopianEuropeanFilipinoFinnishFrenchFrench American IndianFrench CanadianGermanGreekGuamanian / ChamorroGuatemalanGuyaneseHaitianHonduranHungarianIcelanderIndian (Asian)IndonesianInupiatIranianIraqiIrishIroquoisIsraeliItalianJamaicanJapaneseJordanianKenyanKoreanLaotianLatvianLebaneseLithuanianMacedonianMalaysianMalteseMexicanMexican American IndianMongolianMoroccanNative HawaiianNavajoNew ZealanderNicaraguanNigerianNorthern EuropeanNorwegianPakistaniPalestinianPanamanianParaguayanPennsylvania GermanPeruvianPolishPortuguesePuerto RicanRomanianRussianSalvadoranSamoanScandinavianScotch-IrishScottishSeminoleSenegaleseSerbianSiouxSlavicSlovakSloveneSouth AfricanSouth AmericanSouth American IndianSpaniardSpanishSpanish AmericanSpanish American IndianSri LankanSubsaharan AfricanSudaneseSwedishSwissSyrianThaiTrinidadian and TobagonianTurkishU.S. Virgin IslanderUkrainianUruguayanVenezuelanVietnameseWelshWest IndianYugoslavianZimbabwean
Immigrant Origin (Total)
AfghanistanAfricaAlbaniaArgentinaArmeniaAsiaAustraliaAustriaBahamasBangladeshBarbadosBelarusBelgiumBelizeBoliviaBosnia and HerzegovinaBrazilBulgariaBurma / MyanmarCambodiaCameroonCanadaCaribbeanCentral AmericaChileChinaColombiaCosta RicaCroatiaCubaCzechoslovakiaDenmarkDominicaDominican RepublicEastern AfricaEastern AsiaEastern EuropeEcuadorEgyptEl SalvadorEnglandEthiopiaEuropeFranceGermanyGreeceGrenadaGuatemalaGuyanaHaitiHondurasHong KongHungaryIndiaIndonesiaIranIraqIrelandIsraelItalyJamaicaJapanJordanKazakhstanKenyaKoreaKuwaitLaosLatin AmericaLatviaLebanonLithuaniaMalaysiaMexicoMiddle AfricaMoldovaMoroccoNepalNetherlandsNicaraguaNigeriaNorthern AfricaNorthern EuropeNorwayOceaniaPakistanPanamaPeruPhilippinesPolandPortugalRomaniaRussiaSaudi ArabiaScotlandSerbiaSingaporeSouth AfricaSouth AmericaSouth Central AsiaSouth Eastern AsiaSouthern EuropeSpainSri LankaSt. Vincent and the GrenadinesSudanSwedenSwitzerlandSyriaTaiwanThailandTrinidad and TobagoTurkeyUgandaUkraineUruguayUzbekistanVenezuelaVietnamWest IndiesWestern AfricaWestern AsiaWestern EuropeZaireZimbabwe
Immigrant Origin (Percentage)
AfghanistanAfricaAlbaniaArgentinaArmeniaAsiaAustraliaAustriaBahamasBangladeshBarbadosBelarusBelgiumBelizeBoliviaBosnia and HerzegovinaBrazilBulgariaBurma / MyanmarCambodiaCameroonCanadaCaribbeanCentral AmericaChileChinaColombiaCosta RicaCroatiaCubaCzechoslovakiaDenmarkDominicaDominican RepublicEastern AfricaEastern AsiaEastern EuropeEcuadorEgyptEl SalvadorEnglandEthiopiaEuropeFranceGermanyGreeceGrenadaGuatemalaGuyanaHaitiHondurasHong KongHungaryIndiaIndonesiaIranIraqIrelandIsraelItalyJamaicaJapanJordanKazakhstanKenyaKoreaKuwaitLaosLatin AmericaLatviaLebanonLithuaniaMalaysiaMexicoMiddle AfricaMoldovaMoroccoNepalNetherlandsNicaraguaNigeriaNorthern AfricaNorthern EuropeNorwayOceaniaPakistanPanamaPeruPhilippinesPolandPortugalRomaniaRussiaSaudi ArabiaScotlandSerbiaSingaporeSouth AfricaSouth AmericaSouth Central AsiaSouth Eastern AsiaSouthern EuropeSpainSri LankaSt. Vincent and the GrenadinesSudanSwedenSwitzerlandSyriaTaiwanThailandTrinidad and TobagoTurkeyUgandaUkraineUruguayUzbekistanVenezuelaVietnamWest IndiesWestern AfricaWestern AsiaWestern EuropeZaireZimbabwe
Income
Income (Families)
Income (Households)
Poverty
Poverty (Families)
Unemployment
Employment Occupations
Employment Industries
Employer Class
Commute Time
Commute Means
School Enrollment
Education by Degree Field
Occupancy
Finances
Physical Characteristics
Miami
States
Florida Cities
Altamonte SpringsApopkaArcadiaBoca RatonBonita SpringsBoynton BeachBradentonBrandonBrooksvilleCape CoralCasselberryClearwaterClermontCocoaCoral SpringsCrestviewCrystal RiverDade CityDavenportDaytona BeachDeerfield BeachDefuniak SpringsDelandDelray BeachDeltonaDunnellonEdgewaterEnglewoodEustisFort LauderdaleFort MyersFort PierceFort Walton BeachGainesvilleGulf BreezeHialeahHolidayHollywoodHomesteadHomosassaHudsonInvernessJacksonvilleJupiterKissimmeeLake CityLake WalesLake WorthLakelandLand O LakesLargoLeesburgLehigh AcresLive OakLongwoodLutzMariannaMelbourneMerritt IslandMiamiMiami BeachMiltonNaplesNew Port RicheyNew Smyrna BeachNorth Fort MyersNorth PortOcalaOkeechobeeOpa LockaOrange ParkOrlandoOrmond BeachOviedoPalm BayPalm Beach GardensPalm CoastPalm HarborPanama CityPanama City BeachPensacolaPerryPinellas ParkPlant CityPompano BeachPort CharlottePort OrangePort Saint LuciePunta GordaQuincyRiverviewSaint AugustineSaint CloudSaint PetersburgSanfordSarasotaSebastianSebringSeminoleSpring HillStuartTallahasseeTampaTarpon SpringsThe VillagesTitusvilleValricoVeniceVero BeachWesley ChapelWest Palm BeachWewahitchkaWinter HavenWinter ParkZephyrhills
Compare Zip Codes
Comparison Subject

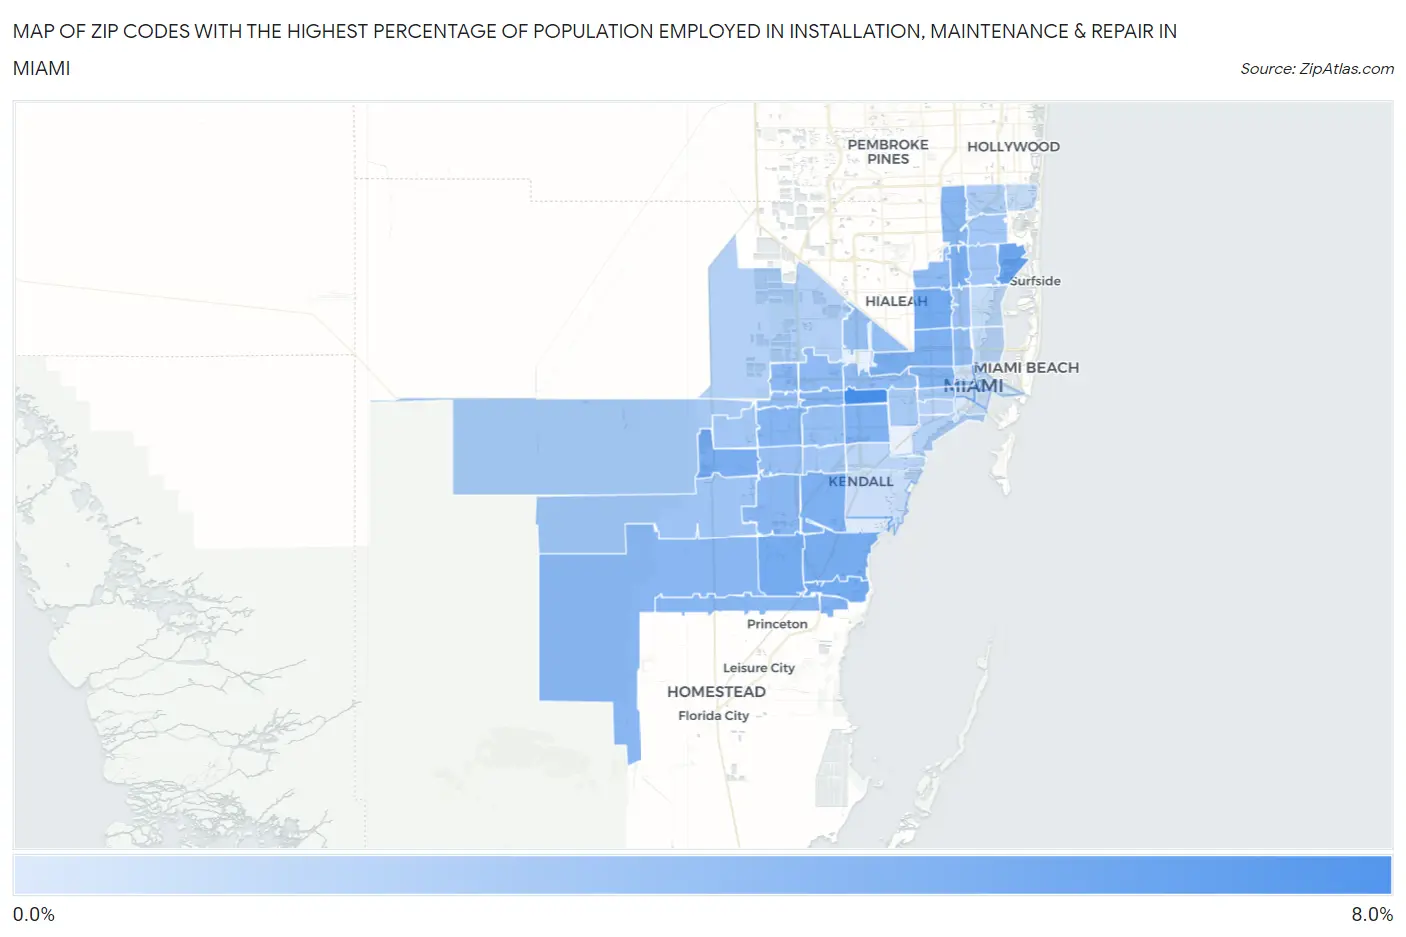
Map of Zip Codes with the Highest Percentage of Population Employed in Installation, Maintenance & Repair in Miami

0.0%
8.0%
Zip Codes with the Highest Percentage of Population Employed in Installation, Maintenance & Repair in Miami Map

Zip Codes with the Highest Percentage of Population Employed in Installation, Maintenance & Repair in Miami, FL

Zip Code % Employed vs State vs National
1.331446.5%3.3%(+3.23)#763.1%(+3.45)#5,164
2.331814.8%3.3%(+1.54)#1823.1%(+1.76)#9,260
3.331474.6%3.3%(+1.27)#2213.1%(+1.49)#10,207
4.331774.5%3.3%(+1.25)#2263.1%(+1.47)#10,297
5.331894.5%3.3%(+1.20)#2333.1%(+1.41)#10,491
6.331574.5%3.3%(+1.17)#2383.1%(+1.39)#10,581
7.331684.3%3.3%(+1.05)#2633.1%(+1.26)#11,035
8.331934.3%3.3%(+1.03)#2683.1%(+1.25)#11,111
9.331424.1%3.3%(+0.820)#2963.1%(+1.04)#11,891
10.331764.1%3.3%(+0.815)#2973.1%(+1.03)#11,914
11.331554.1%3.3%(+0.774)#3053.1%(+0.992)#12,091
12.331254.0%3.3%(+0.682)#3173.1%(+0.900)#12,513
13.331903.9%3.3%(+0.618)#3263.1%(+0.837)#12,783
14.331743.9%3.3%(+0.578)#3333.1%(+0.797)#12,968
15.331753.8%3.3%(+0.511)#3503.1%(+0.729)#13,240
16.331693.7%3.3%(+0.461)#3603.1%(+0.679)#13,471
17.331703.7%3.3%(+0.447)#3633.1%(+0.665)#13,538
18.331873.6%3.3%(+0.348)#3853.1%(+0.566)#14,011
19.331863.6%3.3%(+0.305)#3923.1%(+0.523)#14,191
20.331823.5%3.3%(+0.216)#4103.1%(+0.434)#14,622
21.331723.4%3.3%(+0.136)#4243.1%(+0.354)#14,989
22.331673.4%3.3%(+0.114)#4313.1%(+0.332)#15,086
23.331273.4%3.3%(+0.085)#4413.1%(+0.303)#15,218
24.331263.3%3.3%(+0.024)#4543.1%(+0.242)#15,507
25.331843.3%3.3%(+0.001)#4613.1%(+0.220)#15,612
26.331653.1%3.3%(-0.163)#4913.1%(+0.056)#16,415
27.331663.1%3.3%(-0.176)#4973.1%(+0.043)#16,473
28.331833.1%3.3%(-0.207)#5003.1%(+0.011)#16,616
29.331502.9%3.3%(-0.387)#5333.1%(-0.168)#17,488
30.331962.7%3.3%(-0.570)#5603.1%(-0.351)#18,455
31.331282.7%3.3%(-0.633)#5833.1%(-0.414)#18,801
32.331612.6%3.3%(-0.641)#5863.1%(-0.422)#18,841
33.331852.6%3.3%(-0.686)#5923.1%(-0.467)#19,071
34.331622.6%3.3%(-0.693)#5933.1%(-0.475)#19,100
35.331352.6%3.3%(-0.714)#5993.1%(-0.496)#19,216
36.331732.5%3.3%(-0.759)#6063.1%(-0.541)#19,415
37.331942.4%3.3%(-0.902)#6303.1%(-0.684)#20,140
38.331342.3%3.3%(-0.957)#6463.1%(-0.738)#20,421
39.331792.1%3.3%(-1.20)#6953.1%(-0.984)#21,610
40.331781.9%3.3%(-1.37)#7263.1%(-1.16)#22,419
41.331331.9%3.3%(-1.40)#7343.1%(-1.18)#22,513
42.331451.7%3.3%(-1.63)#7763.1%(-1.41)#23,528
43.331431.6%3.3%(-1.71)#7983.1%(-1.49)#23,849
44.331371.4%3.3%(-1.93)#8253.1%(-1.71)#24,696
45.331381.2%3.3%(-2.06)#8393.1%(-1.84)#25,153
46.331801.2%3.3%(-2.07)#8403.1%(-1.85)#25,195
47.331301.1%3.3%(-2.19)#8533.1%(-1.97)#25,609
48.331560.93%3.3%(-2.36)#8723.1%(-2.14)#26,119
49.331360.70%3.3%(-2.59)#8823.1%(-2.37)#26,777
50.331320.56%3.3%(-2.73)#8893.1%(-2.51)#27,091
51.331310.34%3.3%(-2.95)#8973.1%(-2.73)#27,506
52.331290.30%3.3%(-2.98)#8993.1%(-2.76)#27,551
53.331580.17%3.3%(-3.11)#9053.1%(-2.89)#27,713

Common Questions

What are the Top 10 Zip Codes with the Highest Percentage of Population Employed in Installation, Maintenance & Repair in Miami, FL?
Top 10 Zip Codes with the Highest Percentage of Population Employed in Installation, Maintenance & Repair in Miami, FL are:
#1
6.5%
#2
4.8%
#3
4.6%
#4
4.5%
#5
4.5%
#6
4.5%
#7
4.3%
#8
4.3%
#9
4.1%
#10
4.1%
What zip code has the Highest Percentage of Population Employed in Installation, Maintenance & Repair in Miami, FL?
33144 has the Highest Percentage of Population Employed in Installation, Maintenance & Repair in Miami, FL with 6.5%.
What is the Percentage of Population Employed in Installation, Maintenance & Repair in Miami, FL?
Percentage of Population Employed in Installation, Maintenance & Repair in Miami is 2.3%.
What is the Percentage of Population Employed in Installation, Maintenance & Repair in Florida?
Percentage of Population Employed in Installation, Maintenance & Repair in Florida is 3.3%.
What is the Percentage of Population Employed in Installation, Maintenance & Repair in the United States?
Percentage of Population Employed in Installation, Maintenance & Repair in the United States is 3.1%.