Ute vs Paiute Family Households
COMPARE
Ute
Paiute
Family Households
Family Households Comparison
Ute
Paiute
64.3%
FAMILY HOUSEHOLDS
54.6/ 100
METRIC RATING
171st/ 347
METRIC RANK
64.0%
FAMILY HOUSEHOLDS
22.2/ 100
METRIC RATING
194th/ 347
METRIC RANK
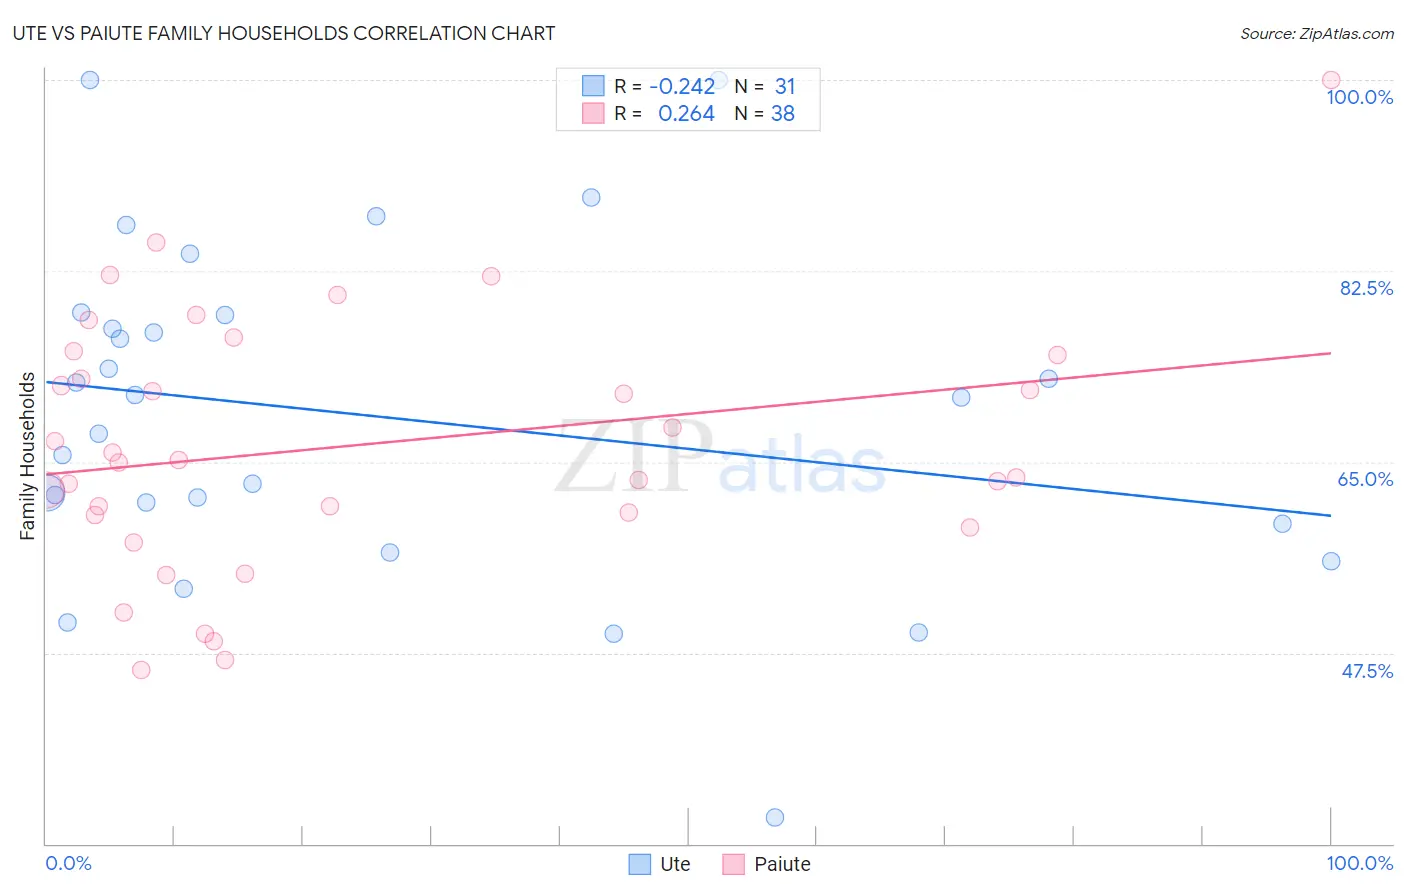
Ute vs Paiute Family Households Correlation Chart
The statistical analysis conducted on geographies consisting of 55,658,478 people shows a weak negative correlation between the proportion of Ute and percentage of family households in the United States with a correlation coefficient (R) of -0.242 and weighted average of 64.3%. Similarly, the statistical analysis conducted on geographies consisting of 58,392,138 people shows a weak positive correlation between the proportion of Paiute and percentage of family households in the United States with a correlation coefficient (R) of 0.264 and weighted average of 64.0%, a difference of 0.49%.
Family Households Correlation Summary
| Measurement | Ute | Paiute |
| Minimum | 32.4% | 46.0% |
| Maximum | 100.0% | 100.0% |
| Range | 67.6% | 54.0% |
| Mean | 69.2% | 66.5% |
| Median | 70.9% | 65.0% |
| Interquartile 25% (IQ1) | 59.4% | 60.2% |
| Interquartile 75% (IQ3) | 78.5% | 74.8% |
| Interquartile Range (IQR) | 19.1% | 14.6% |
| Standard Deviation (Sample) | 15.3% | 11.7% |
| Standard Deviation (Population) | 15.0% | 11.6% |
Similar Demographics by Family Households
Demographics Similar to Ute by Family Households
In terms of family households, the demographic groups most similar to Ute are Dutch West Indian (64.3%, a difference of 0.010%), Iraqi (64.4%, a difference of 0.020%), Armenian (64.4%, a difference of 0.020%), Immigrants from Sierra Leone (64.3%, a difference of 0.030%), and Irish (64.4%, a difference of 0.040%).
| Demographics | Rating | Rank | Family Households |
| Immigrants | Nigeria | 60.1 /100 | #164 | Good 64.4% |
| Immigrants | Southern Europe | 60.0 /100 | #165 | Good 64.4% |
| Scotch-Irish | 59.2 /100 | #166 | Average 64.4% |
| Irish | 57.9 /100 | #167 | Average 64.4% |
| Hondurans | 57.5 /100 | #168 | Average 64.4% |
| Iraqis | 56.0 /100 | #169 | Average 64.4% |
| Armenians | 55.9 /100 | #170 | Average 64.4% |
| Ute | 54.6 /100 | #171 | Average 64.3% |
| Dutch West Indians | 53.9 /100 | #172 | Average 64.3% |
| Immigrants | Sierra Leone | 52.5 /100 | #173 | Average 64.3% |
| Immigrants | Germany | 50.0 /100 | #174 | Average 64.3% |
| Bangladeshis | 44.3 /100 | #175 | Average 64.3% |
| Vietnamese | 43.6 /100 | #176 | Average 64.2% |
| Immigrants | Micronesia | 42.3 /100 | #177 | Average 64.2% |
| Jamaicans | 40.6 /100 | #178 | Average 64.2% |
Demographics Similar to Paiute by Family Households
In terms of family households, the demographic groups most similar to Paiute are Lithuanian (64.0%, a difference of 0.030%), French (64.0%, a difference of 0.030%), Arab (64.1%, a difference of 0.040%), Immigrants from North America (64.0%, a difference of 0.040%), and Zimbabwean (64.1%, a difference of 0.050%).
| Demographics | Rating | Rank | Family Households |
| Northern Europeans | 28.2 /100 | #187 | Fair 64.1% |
| Paraguayans | 26.7 /100 | #188 | Fair 64.1% |
| Immigrants | Western Asia | 25.3 /100 | #189 | Fair 64.1% |
| Zimbabweans | 24.7 /100 | #190 | Fair 64.1% |
| Arabs | 24.5 /100 | #191 | Fair 64.1% |
| Lithuanians | 23.8 /100 | #192 | Fair 64.0% |
| French | 23.7 /100 | #193 | Fair 64.0% |
| Paiute | 22.2 /100 | #194 | Fair 64.0% |
| Immigrants | North America | 20.0 /100 | #195 | Poor 64.0% |
| Immigrants | Canada | 19.2 /100 | #196 | Poor 64.0% |
| Seminole | 18.9 /100 | #197 | Poor 64.0% |
| Poles | 18.9 /100 | #198 | Poor 64.0% |
| Slavs | 18.6 /100 | #199 | Poor 64.0% |
| Immigrants | Malaysia | 17.9 /100 | #200 | Poor 64.0% |
| Immigrants | Eastern Europe | 17.2 /100 | #201 | Poor 64.0% |