Ute vs Immigrants from South Central Asia Family Households
COMPARE
Ute
Immigrants from South Central Asia
Family Households
Family Households Comparison
Ute
Immigrants from South Central Asia
64.3%
FAMILY HOUSEHOLDS
54.6/ 100
METRIC RATING
171st/ 347
METRIC RANK
66.4%
FAMILY HOUSEHOLDS
100.0/ 100
METRIC RATING
49th/ 347
METRIC RANK
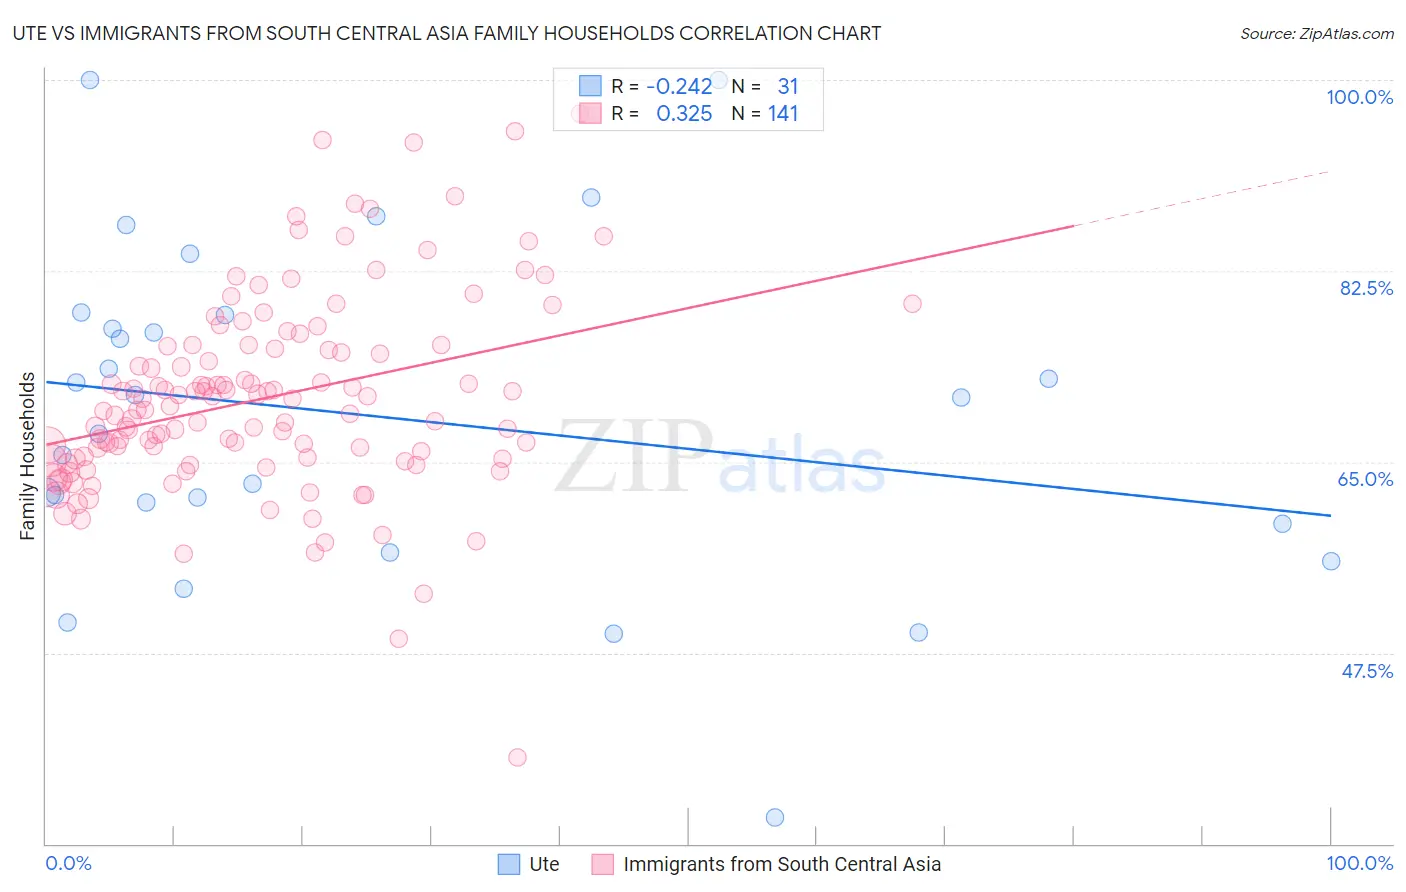
Ute vs Immigrants from South Central Asia Family Households Correlation Chart
The statistical analysis conducted on geographies consisting of 55,658,478 people shows a weak negative correlation between the proportion of Ute and percentage of family households in the United States with a correlation coefficient (R) of -0.242 and weighted average of 64.3%. Similarly, the statistical analysis conducted on geographies consisting of 472,677,474 people shows a mild positive correlation between the proportion of Immigrants from South Central Asia and percentage of family households in the United States with a correlation coefficient (R) of 0.325 and weighted average of 66.4%, a difference of 3.2%.
Family Households Correlation Summary
| Measurement | Ute | Immigrants from South Central Asia |
| Minimum | 32.4% | 37.9% |
| Maximum | 100.0% | 97.0% |
| Range | 67.6% | 59.0% |
| Mean | 69.2% | 70.8% |
| Median | 70.9% | 69.8% |
| Interquartile 25% (IQ1) | 59.4% | 65.3% |
| Interquartile 75% (IQ3) | 78.5% | 75.5% |
| Interquartile Range (IQR) | 19.1% | 10.2% |
| Standard Deviation (Sample) | 15.3% | 9.0% |
| Standard Deviation (Population) | 15.0% | 9.0% |
Similar Demographics by Family Households
Demographics Similar to Ute by Family Households
In terms of family households, the demographic groups most similar to Ute are Dutch West Indian (64.3%, a difference of 0.010%), Iraqi (64.4%, a difference of 0.020%), Armenian (64.4%, a difference of 0.020%), Immigrants from Sierra Leone (64.3%, a difference of 0.030%), and Irish (64.4%, a difference of 0.040%).
| Demographics | Rating | Rank | Family Households |
| Immigrants | Nigeria | 60.1 /100 | #164 | Good 64.4% |
| Immigrants | Southern Europe | 60.0 /100 | #165 | Good 64.4% |
| Scotch-Irish | 59.2 /100 | #166 | Average 64.4% |
| Irish | 57.9 /100 | #167 | Average 64.4% |
| Hondurans | 57.5 /100 | #168 | Average 64.4% |
| Iraqis | 56.0 /100 | #169 | Average 64.4% |
| Armenians | 55.9 /100 | #170 | Average 64.4% |
| Ute | 54.6 /100 | #171 | Average 64.3% |
| Dutch West Indians | 53.9 /100 | #172 | Average 64.3% |
| Immigrants | Sierra Leone | 52.5 /100 | #173 | Average 64.3% |
| Immigrants | Germany | 50.0 /100 | #174 | Average 64.3% |
| Bangladeshis | 44.3 /100 | #175 | Average 64.3% |
| Vietnamese | 43.6 /100 | #176 | Average 64.2% |
| Immigrants | Micronesia | 42.3 /100 | #177 | Average 64.2% |
| Jamaicans | 40.6 /100 | #178 | Average 64.2% |
Demographics Similar to Immigrants from South Central Asia by Family Households
In terms of family households, the demographic groups most similar to Immigrants from South Central Asia are Immigrants from Venezuela (66.4%, a difference of 0.050%), Bolivian (66.5%, a difference of 0.070%), Navajo (66.4%, a difference of 0.070%), Native/Alaskan (66.4%, a difference of 0.090%), and Arapaho (66.5%, a difference of 0.10%).
| Demographics | Rating | Rank | Family Households |
| Menominee | 100.0 /100 | #42 | Exceptional 66.5% |
| Apache | 100.0 /100 | #43 | Exceptional 66.5% |
| Asians | 100.0 /100 | #44 | Exceptional 66.5% |
| Venezuelans | 100.0 /100 | #45 | Exceptional 66.5% |
| Arapaho | 100.0 /100 | #46 | Exceptional 66.5% |
| Bolivians | 100.0 /100 | #47 | Exceptional 66.5% |
| Immigrants | Venezuela | 100.0 /100 | #48 | Exceptional 66.4% |
| Immigrants | South Central Asia | 100.0 /100 | #49 | Exceptional 66.4% |
| Navajo | 100.0 /100 | #50 | Exceptional 66.4% |
| Natives/Alaskans | 100.0 /100 | #51 | Exceptional 66.4% |
| Colombians | 100.0 /100 | #52 | Exceptional 66.3% |
| Afghans | 100.0 /100 | #53 | Exceptional 66.3% |
| Immigrants | Colombia | 100.0 /100 | #54 | Exceptional 66.3% |
| Immigrants | Immigrants | 100.0 /100 | #55 | Exceptional 66.1% |
| Immigrants | Hong Kong | 100.0 /100 | #56 | Exceptional 66.1% |