Subsaharan African vs Apache Family Households with Children

COMPARE

Subsaharan African
Race
Ancestry
AfghanAfricanAlaska NativeAlaskan AthabascanAlbanianAleutAlsatianAmericanArabArapahoArgentineanArmenianAssyrian/Chaldean/SyriacAustralianAustrianBahamianBangladeshiBarbadianBasqueBelgianBelizeanBermudanBhutaneseBlackfeetBolivianBrazilianBritishBritish West IndianBulgarianBurmeseCajunCambodianCanadianCape VerdeanCarpatho RusynCelticCentral AmericanCentral American IndianCherokeeCheyenneChickasawChileanChineseChippewaChoctawColombianColvilleComancheCosta RicanCreeCreekCroatianCrowCubanCypriotCzechCzechoslovakianDanishDelawareDominicanDutchDutch West IndianEastern EuropeanEcuadorianEgyptianEnglishEstonianEthiopianEuropeanFijianFilipinoFinnishFrenchFrench American IndianFrench CanadianGermanGerman RussianGhanaianGreekGuamanian/ChamorroGuatemalanGuyaneseHaitianHmongHonduranHopiHoumaHungarianIcelanderIndian (Asian)IndonesianInupiatIranianIraqiIrishIroquoisIsraeliItalianJamaicanJapaneseJordanianKenyanKiowaKoreanLaotianLatvianLebaneseLiberianLithuanianLumbeeLuxembourgerMacedonianMalaysianMalteseMarshalleseMenomineeMexicanMexican American IndianMongolianMoroccanNative HawaiianNavajoNepaleseNew ZealanderNicaraguanNigerianNorthern EuropeanNorwegianOkinawanOsageOttawaPaiutePakistaniPalestinianPanamanianParaguayanPennsylvania GermanPeruvianPimaPolishPortuguesePotawatomiPuebloPuerto RicanPuget Sound SalishRomanianRussianSalvadoranSamoanScandinavianScotch-IrishScottishSeminoleSenegaleseSerbianShoshoneSierra LeoneanSiouxSlavicSlovakSloveneSomaliSouth AfricanSouth AmericanSouth American IndianSoviet UnionSpaniardSpanishSpanish AmericanSpanish American IndianSri LankanSubsaharan AfricanSudaneseSwedishSwissSyrianTaiwaneseThaiTlingit-HaidaTohono O'OdhamTonganTrinidadian and TobagonianTsimshianTurkishU.S. Virgin IslanderUgandanUkrainianUruguayanUteVenezuelanVietnameseWelshWest IndianYakamaYaquiYugoslavianYumanYup'ikZimbabwean
Immigration
NonimmigrantsImmigrantsAfghanistanAfricaAlbaniaArgentinaArmeniaAsiaAustraliaAustriaBahamasBangladeshBarbadosBelarusBelgiumBelizeBoliviaBosnia and HerzegovinaBrazilBulgariaBurma/MyanmarCabo VerdeCambodiaCameroonCanadaCaribbeanCentral AmericaChileChinaColombiaCongoCosta RicaCroatiaCubaCzechoslovakiaDenmarkDominicaDominican RepublicEastern AfricaEastern AsiaEastern EuropeEcuadorEgyptEl SalvadorEnglandEritreaEthiopiaEuropeFijiFranceGermanyGhanaGreeceGrenadaGuatemalaGuyanaHaitiHondurasHong KongHungaryIndiaIndonesiaIranIraqIrelandIsraelItalyJamaicaJapanJordanKazakhstanKenyaKoreaKuwaitLaosLatin AmericaLatviaLebanonLiberiaLithuaniaMalaysiaMexicoMicronesiaMiddle AfricaMoldovaMoroccoNepalNetherlandsNicaraguaNigeriaNorth AmericaNorth MacedoniaNorthern AfricaNorthern EuropeNorwayOceaniaPakistanPanamaPeruPhilippinesPolandPortugalRomaniaRussiaSaudi ArabiaScotlandSenegalSerbiaSierra LeoneSingaporeSomaliaSouth AfricaSouth AmericaSouth Central AsiaSouth Eastern AsiaSouthern EuropeSpainSri LankaSt. Vincent and the GrenadinesSudanSwedenSwitzerlandSyriaTaiwanThailandTrinidad and TobagoTurkeyUgandaUkraineUruguayUzbekistanVenezuelaVietnamWest IndiesWestern AfricaWestern AsiaWestern EuropeYemenZaireZimbabweAzores
Apache
Race
Ancestry
AfghanAfricanAlaska NativeAlaskan AthabascanAlbanianAleutAlsatianAmericanApacheArabArapahoArgentineanArmenianAssyrian/Chaldean/SyriacAustralianAustrianBahamianBangladeshiBarbadianBasqueBelgianBelizeanBermudanBhutaneseBlackfeetBolivianBrazilianBritishBritish West IndianBulgarianBurmeseCajunCambodianCanadianCape VerdeanCarpatho RusynCelticCentral AmericanCentral American IndianCherokeeCheyenneChickasawChileanChineseChippewaChoctawColombianColvilleComancheCosta RicanCreeCreekCroatianCrowCubanCypriotCzechCzechoslovakianDanishDelawareDominicanDutchDutch West IndianEastern EuropeanEcuadorianEgyptianEnglishEstonianEthiopianEuropeanFijianFilipinoFinnishFrenchFrench American IndianFrench CanadianGermanGerman RussianGhanaianGreekGuamanian/ChamorroGuatemalanGuyaneseHaitianHmongHonduranHopiHoumaHungarianIcelanderIndian (Asian)IndonesianInupiatIranianIraqiIrishIroquoisIsraeliItalianJamaicanJapaneseJordanianKenyanKiowaKoreanLaotianLatvianLebaneseLiberianLithuanianLumbeeLuxembourgerMacedonianMalaysianMalteseMarshalleseMenomineeMexicanMexican American IndianMongolianMoroccanNative HawaiianNavajoNepaleseNew ZealanderNicaraguanNigerianNorthern EuropeanNorwegianOkinawanOsageOttawaPaiutePakistaniPalestinianPanamanianParaguayanPennsylvania GermanPeruvianPimaPolishPortuguesePotawatomiPuebloPuerto RicanPuget Sound SalishRomanianRussianSalvadoranSamoanScandinavianScotch-IrishScottishSeminoleSenegaleseSerbianShoshoneSierra LeoneanSiouxSlavicSlovakSloveneSomaliSouth AfricanSouth AmericanSouth American IndianSoviet UnionSpaniardSpanishSpanish AmericanSpanish American IndianSri LankanSudaneseSwedishSwissSyrianTaiwaneseThaiTlingit-HaidaTohono O'OdhamTonganTrinidadian and TobagonianTsimshianTurkishU.S. Virgin IslanderUgandanUkrainianUruguayanUteVenezuelanVietnameseWelshWest IndianYakamaYaquiYugoslavianYumanYup'ikZimbabwean
Immigration
NonimmigrantsImmigrantsAfghanistanAfricaAlbaniaArgentinaArmeniaAsiaAustraliaAustriaBahamasBangladeshBarbadosBelarusBelgiumBelizeBoliviaBosnia and HerzegovinaBrazilBulgariaBurma/MyanmarCabo VerdeCambodiaCameroonCanadaCaribbeanCentral AmericaChileChinaColombiaCongoCosta RicaCroatiaCubaCzechoslovakiaDenmarkDominicaDominican RepublicEastern AfricaEastern AsiaEastern EuropeEcuadorEgyptEl SalvadorEnglandEritreaEthiopiaEuropeFijiFranceGermanyGhanaGreeceGrenadaGuatemalaGuyanaHaitiHondurasHong KongHungaryIndiaIndonesiaIranIraqIrelandIsraelItalyJamaicaJapanJordanKazakhstanKenyaKoreaKuwaitLaosLatin AmericaLatviaLebanonLiberiaLithuaniaMalaysiaMexicoMicronesiaMiddle AfricaMoldovaMoroccoNepalNetherlandsNicaraguaNigeriaNorth AmericaNorth MacedoniaNorthern AfricaNorthern EuropeNorwayOceaniaPakistanPanamaPeruPhilippinesPolandPortugalRomaniaRussiaSaudi ArabiaScotlandSenegalSerbiaSierra LeoneSingaporeSomaliaSouth AfricaSouth AmericaSouth Central AsiaSouth Eastern AsiaSouthern EuropeSpainSri LankaSt. Vincent and the GrenadinesSudanSwedenSwitzerlandSyriaTaiwanThailandTrinidad and TobagoTurkeyUgandaUkraineUruguayUzbekistanVenezuelaVietnamWest IndiesWestern AfricaWestern AsiaWestern EuropeYemenZaireZimbabweAzores
Family Households with Children
Income
Poverty
Unemployment
Labor Participation
Family Structure
Vehicle Availability
Education Level
Disability

Family Households with Children Comparison

Sub-Saharan Africans

Apache

Good
Exceptional
27.6%
FAMILY HOUSEHOLDS WITH CHILDREN
67.5/ 100
METRIC RATING
160th/ 347
METRIC RANK
29.0%
FAMILY HOUSEHOLDS WITH CHILDREN
100.0/ 100
METRIC RATING
48th/ 347
METRIC RANK

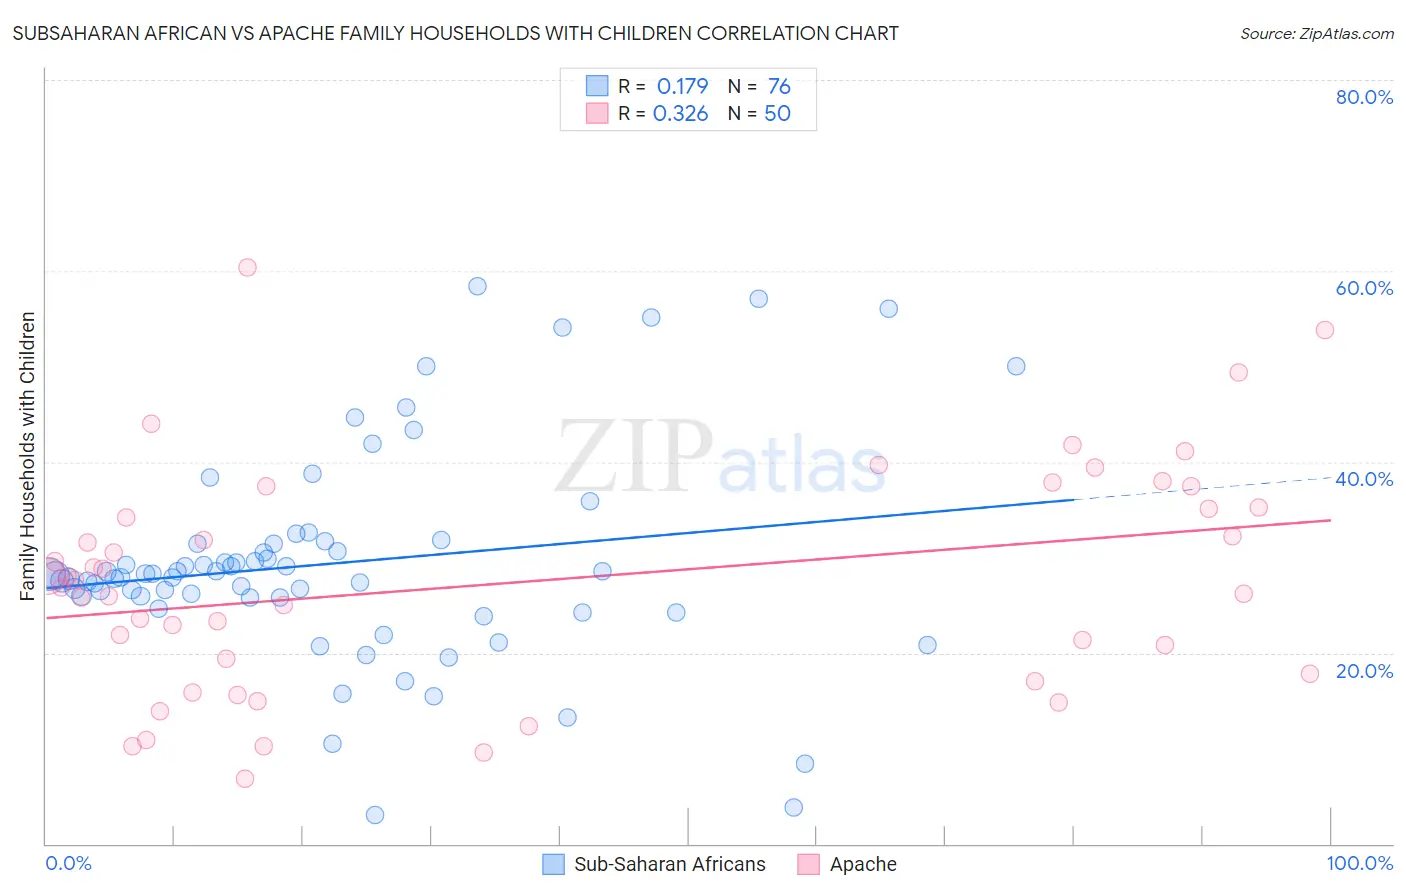
Subsaharan African vs Apache Family Households with Children Correlation Chart

The statistical analysis conducted on geographies consisting of 507,337,784 people shows a poor positive correlation between the proportion of Sub-Saharan Africans and percentage of family households with children in the United States with a correlation coefficient (R) of 0.179 and weighted average of 27.6%. Similarly, the statistical analysis conducted on geographies consisting of 231,023,024 people shows a mild positive correlation between the proportion of Apache and percentage of family households with children in the United States with a correlation coefficient (R) of 0.326 and weighted average of 29.0%, a difference of 5.2%.
Subsaharan African vs Apache Family Households with Children

Family Households with Children Correlation Summary

MeasurementSubsaharan AfricanApache
Minimum3.0%6.8%
Maximum58.3%60.3%
Range55.4%53.6%
Mean29.4%27.5%
Median28.2%27.2%
Interquartile 25% (IQ1)25.8%17.8%
Interquartile 75% (IQ3)31.4%35.2%
Interquartile Range (IQR)5.6%17.4%
Standard Deviation (Sample)11.1%11.9%
Standard Deviation (Population)11.0%11.8%

Similar Demographics by Family Households with Children

Demographics Similar to Sub-Saharan Africans by Family Households with Children

In terms of family households with children, the demographic groups most similar to Sub-Saharan Africans are Alaskan Athabascan (27.6%, a difference of 0.010%), Immigrants from Bangladesh (27.6%, a difference of 0.010%), Czech (27.5%, a difference of 0.050%), Immigrants from Hong Kong (27.5%, a difference of 0.060%), and Romanian (27.6%, a difference of 0.080%).
DemographicsRating | RankFamily Households with Children
Immigrants | Cabo Verde
75.6
/100
|
#153
Good
27.6%
Icelanders
75.3
/100
|
#154
Good
27.6%
Comanche
74.8
/100
|
#155
Good
27.6%
Hungarians
74.6
/100
|
#156
Good
27.6%
Indians (Asian)
71.6
/100
|
#157
Good
27.6%
Romanians
70.8
/100
|
#158
Good
27.6%
Mongolians
70.7
/100
|
#159
Good
27.6%
Sub-Saharan Africans
67.5
/100
|
#160
Good
27.6%
Alaskan Athabascans
67.1
/100
|
#161
Good
27.6%
Immigrants | Bangladesh
67.0
/100
|
#162
Good
27.6%
Czechs
65.3
/100
|
#163
Good
27.5%
Immigrants | Hong Kong
64.9
/100
|
#164
Good
27.5%
Immigrants | South Africa
61.3
/100
|
#165
Good
27.5%
Immigrants | Nonimmigrants
61.2
/100
|
#166
Good
27.5%
Dominicans
61.1
/100
|
#167
Good
27.5%

Demographics Similar to Apache by Family Households with Children

In terms of family households with children, the demographic groups most similar to Apache are Peruvian (29.0%, a difference of 0.030%), Immigrants from Philippines (29.0%, a difference of 0.040%), Jordanian (29.0%, a difference of 0.090%), Fijian (29.0%, a difference of 0.13%), and Immigrants from Taiwan (29.0%, a difference of 0.18%).
DemographicsRating | RankFamily Households with Children
Immigrants | South Eastern Asia
100.0
/100
|
#41
Exceptional
29.1%
Spanish American Indians
100.0
/100
|
#42
Exceptional
29.1%
Asians
100.0
/100
|
#43
Exceptional
29.1%
Immigrants | Taiwan
100.0
/100
|
#44
Exceptional
29.0%
Fijians
100.0
/100
|
#45
Exceptional
29.0%
Immigrants | Philippines
100.0
/100
|
#46
Exceptional
29.0%
Peruvians
100.0
/100
|
#47
Exceptional
29.0%
Apache
100.0
/100
|
#48
Exceptional
29.0%
Jordanians
100.0
/100
|
#49
Exceptional
29.0%
Immigrants | Immigrants
100.0
/100
|
#50
Exceptional
28.9%
Immigrants | Peru
100.0
/100
|
#51
Exceptional
28.9%
Guatemalans
100.0
/100
|
#52
Exceptional
28.9%
Immigrants | Cambodia
100.0
/100
|
#53
Exceptional
28.9%
Sierra Leoneans
100.0
/100
|
#54
Exceptional
28.9%
Immigrants | Asia
100.0
/100
|
#55
Exceptional
28.8%