Subsaharan African vs African Family Households with Children
COMPARE
Subsaharan African
African
Family Households with Children
Family Households with Children Comparison
Sub-Saharan Africans
Africans
27.6%
FAMILY HOUSEHOLDS WITH CHILDREN
67.5/ 100
METRIC RATING
160th/ 347
METRIC RANK
27.2%
FAMILY HOUSEHOLDS WITH CHILDREN
13.0/ 100
METRIC RATING
214th/ 347
METRIC RANK
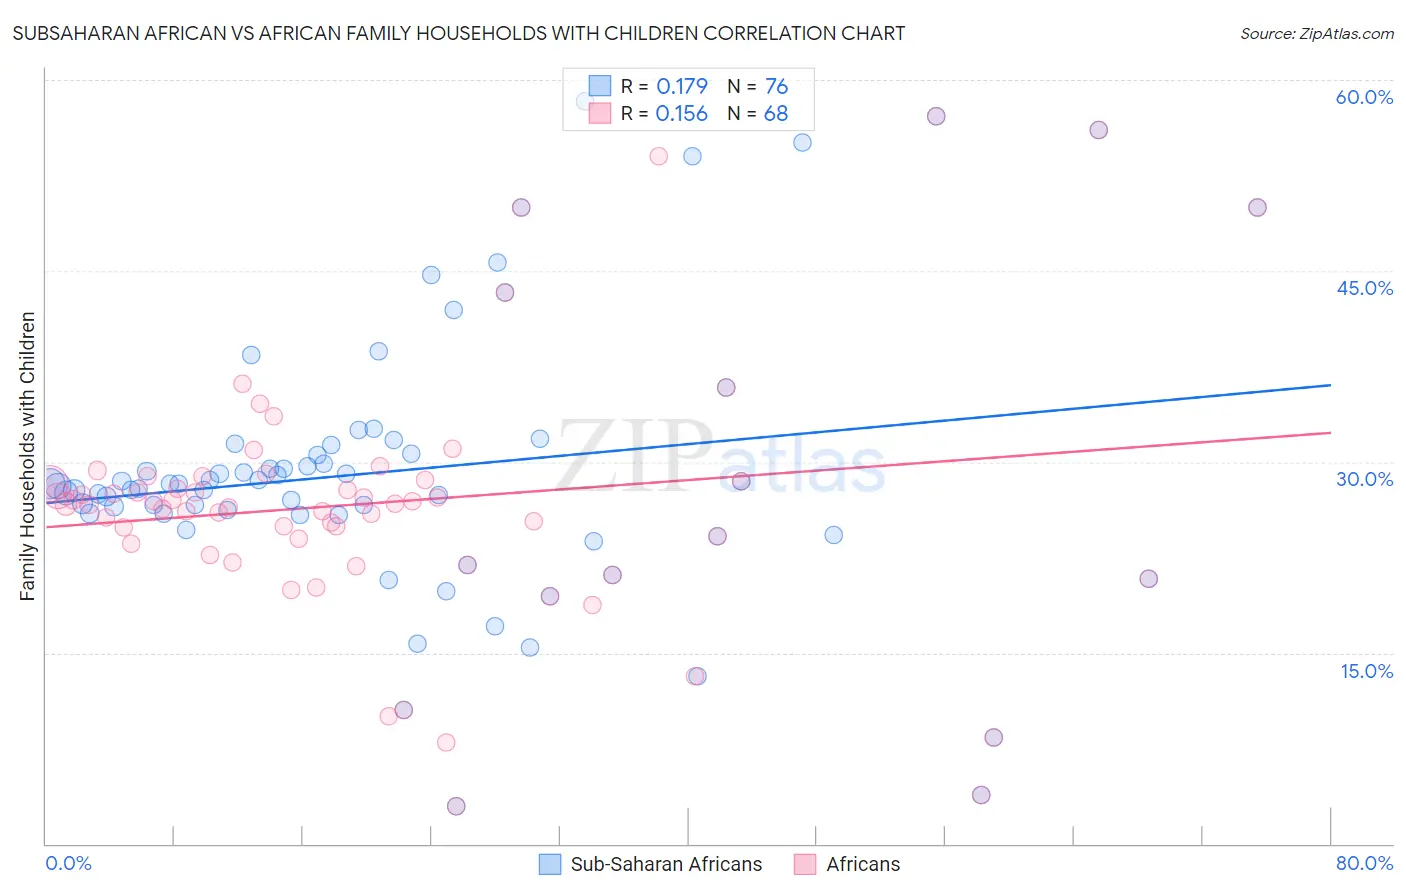
Subsaharan African vs African Family Households with Children Correlation Chart
The statistical analysis conducted on geographies consisting of 507,337,784 people shows a poor positive correlation between the proportion of Sub-Saharan Africans and percentage of family households with children in the United States with a correlation coefficient (R) of 0.179 and weighted average of 27.6%. Similarly, the statistical analysis conducted on geographies consisting of 469,417,507 people shows a poor positive correlation between the proportion of Africans and percentage of family households with children in the United States with a correlation coefficient (R) of 0.156 and weighted average of 27.2%, a difference of 1.5%.
Family Households with Children Correlation Summary
| Measurement | Subsaharan African | African |
| Minimum | 3.0% | 3.0% |
| Maximum | 58.3% | 57.1% |
| Range | 55.4% | 54.2% |
| Mean | 29.4% | 26.8% |
| Median | 28.2% | 26.7% |
| Interquartile 25% (IQ1) | 25.8% | 23.1% |
| Interquartile 75% (IQ3) | 31.4% | 28.7% |
| Interquartile Range (IQR) | 5.6% | 5.6% |
| Standard Deviation (Sample) | 11.1% | 10.3% |
| Standard Deviation (Population) | 11.0% | 10.3% |
Similar Demographics by Family Households with Children
Demographics Similar to Sub-Saharan Africans by Family Households with Children
In terms of family households with children, the demographic groups most similar to Sub-Saharan Africans are Alaskan Athabascan (27.6%, a difference of 0.010%), Immigrants from Bangladesh (27.6%, a difference of 0.010%), Czech (27.5%, a difference of 0.050%), Immigrants from Hong Kong (27.5%, a difference of 0.060%), and Romanian (27.6%, a difference of 0.080%).
| Demographics | Rating | Rank | Family Households with Children |
| Immigrants | Cabo Verde | 75.6 /100 | #153 | Good 27.6% |
| Icelanders | 75.3 /100 | #154 | Good 27.6% |
| Comanche | 74.8 /100 | #155 | Good 27.6% |
| Hungarians | 74.6 /100 | #156 | Good 27.6% |
| Indians (Asian) | 71.6 /100 | #157 | Good 27.6% |
| Romanians | 70.8 /100 | #158 | Good 27.6% |
| Mongolians | 70.7 /100 | #159 | Good 27.6% |
| Sub-Saharan Africans | 67.5 /100 | #160 | Good 27.6% |
| Alaskan Athabascans | 67.1 /100 | #161 | Good 27.6% |
| Immigrants | Bangladesh | 67.0 /100 | #162 | Good 27.6% |
| Czechs | 65.3 /100 | #163 | Good 27.5% |
| Immigrants | Hong Kong | 64.9 /100 | #164 | Good 27.5% |
| Immigrants | South Africa | 61.3 /100 | #165 | Good 27.5% |
| Immigrants | Nonimmigrants | 61.2 /100 | #166 | Good 27.5% |
| Dominicans | 61.1 /100 | #167 | Good 27.5% |
Demographics Similar to Africans by Family Households with Children
In terms of family households with children, the demographic groups most similar to Africans are Northern European (27.2%, a difference of 0.010%), Immigrants from Dominica (27.2%, a difference of 0.040%), Okinawan (27.2%, a difference of 0.040%), Cuban (27.1%, a difference of 0.040%), and U.S. Virgin Islander (27.1%, a difference of 0.040%).
| Demographics | Rating | Rank | Family Households with Children |
| Haitians | 19.8 /100 | #207 | Poor 27.2% |
| Immigrants | Poland | 16.4 /100 | #208 | Poor 27.2% |
| Dutch West Indians | 15.8 /100 | #209 | Poor 27.2% |
| Immigrants | Ukraine | 14.4 /100 | #210 | Poor 27.2% |
| Welsh | 14.2 /100 | #211 | Poor 27.2% |
| Immigrants | Dominica | 13.9 /100 | #212 | Poor 27.2% |
| Okinawans | 13.7 /100 | #213 | Poor 27.2% |
| Africans | 13.0 /100 | #214 | Poor 27.2% |
| Northern Europeans | 12.8 /100 | #215 | Poor 27.2% |
| Cubans | 12.2 /100 | #216 | Poor 27.1% |
| U.S. Virgin Islanders | 12.1 /100 | #217 | Poor 27.1% |
| Greeks | 11.4 /100 | #218 | Poor 27.1% |
| Immigrants | Japan | 10.7 /100 | #219 | Poor 27.1% |
| Austrians | 9.9 /100 | #220 | Tragic 27.1% |
| New Zealanders | 9.6 /100 | #221 | Tragic 27.1% |