Colombian vs Apache Family Households with Children

COMPARE

Colombian
Race
Ancestry
AfghanAfricanAlaska NativeAlaskan AthabascanAlbanianAleutAlsatianAmericanArabArapahoArgentineanArmenianAssyrian/Chaldean/SyriacAustralianAustrianBahamianBangladeshiBarbadianBasqueBelgianBelizeanBermudanBhutaneseBlackfeetBolivianBrazilianBritishBritish West IndianBulgarianBurmeseCajunCambodianCanadianCape VerdeanCarpatho RusynCelticCentral AmericanCentral American IndianCherokeeCheyenneChickasawChileanChineseChippewaChoctawColombianColvilleComancheCosta RicanCreeCreekCroatianCrowCubanCypriotCzechCzechoslovakianDanishDelawareDominicanDutchDutch West IndianEastern EuropeanEcuadorianEgyptianEnglishEstonianEthiopianEuropeanFijianFilipinoFinnishFrenchFrench American IndianFrench CanadianGermanGerman RussianGhanaianGreekGuamanian/ChamorroGuatemalanGuyaneseHaitianHmongHonduranHopiHoumaHungarianIcelanderIndian (Asian)IndonesianInupiatIranianIraqiIrishIroquoisIsraeliItalianJamaicanJapaneseJordanianKenyanKiowaKoreanLaotianLatvianLebaneseLiberianLithuanianLumbeeLuxembourgerMacedonianMalaysianMalteseMarshalleseMenomineeMexicanMexican American IndianMongolianMoroccanNative HawaiianNavajoNepaleseNew ZealanderNicaraguanNigerianNorthern EuropeanNorwegianOkinawanOsageOttawaPaiutePakistaniPalestinianPanamanianParaguayanPennsylvania GermanPeruvianPimaPolishPortuguesePotawatomiPuebloPuerto RicanPuget Sound SalishRomanianRussianSalvadoranSamoanScandinavianScotch-IrishScottishSeminoleSenegaleseSerbianShoshoneSierra LeoneanSiouxSlavicSlovakSloveneSomaliSouth AfricanSouth AmericanSouth American IndianSoviet UnionSpaniardSpanishSpanish AmericanSpanish American IndianSri LankanSubsaharan AfricanSudaneseSwedishSwissSyrianTaiwaneseThaiTlingit-HaidaTohono O'OdhamTonganTrinidadian and TobagonianTsimshianTurkishU.S. Virgin IslanderUgandanUkrainianUruguayanUteVenezuelanVietnameseWelshWest IndianYakamaYaquiYugoslavianYumanYup'ikZimbabwean
Immigration
NonimmigrantsImmigrantsAfghanistanAfricaAlbaniaArgentinaArmeniaAsiaAustraliaAustriaBahamasBangladeshBarbadosBelarusBelgiumBelizeBoliviaBosnia and HerzegovinaBrazilBulgariaBurma/MyanmarCabo VerdeCambodiaCameroonCanadaCaribbeanCentral AmericaChileChinaColombiaCongoCosta RicaCroatiaCubaCzechoslovakiaDenmarkDominicaDominican RepublicEastern AfricaEastern AsiaEastern EuropeEcuadorEgyptEl SalvadorEnglandEritreaEthiopiaEuropeFijiFranceGermanyGhanaGreeceGrenadaGuatemalaGuyanaHaitiHondurasHong KongHungaryIndiaIndonesiaIranIraqIrelandIsraelItalyJamaicaJapanJordanKazakhstanKenyaKoreaKuwaitLaosLatin AmericaLatviaLebanonLiberiaLithuaniaMalaysiaMexicoMicronesiaMiddle AfricaMoldovaMoroccoNepalNetherlandsNicaraguaNigeriaNorth AmericaNorth MacedoniaNorthern AfricaNorthern EuropeNorwayOceaniaPakistanPanamaPeruPhilippinesPolandPortugalRomaniaRussiaSaudi ArabiaScotlandSenegalSerbiaSierra LeoneSingaporeSomaliaSouth AfricaSouth AmericaSouth Central AsiaSouth Eastern AsiaSouthern EuropeSpainSri LankaSt. Vincent and the GrenadinesSudanSwedenSwitzerlandSyriaTaiwanThailandTrinidad and TobagoTurkeyUgandaUkraineUruguayUzbekistanVenezuelaVietnamWest IndiesWestern AfricaWestern AsiaWestern EuropeYemenZaireZimbabweAzores
Apache
Race
Ancestry
AfghanAfricanAlaska NativeAlaskan AthabascanAlbanianAleutAlsatianAmericanApacheArabArapahoArgentineanArmenianAssyrian/Chaldean/SyriacAustralianAustrianBahamianBangladeshiBarbadianBasqueBelgianBelizeanBermudanBhutaneseBlackfeetBolivianBrazilianBritishBritish West IndianBulgarianBurmeseCajunCambodianCanadianCape VerdeanCarpatho RusynCelticCentral AmericanCentral American IndianCherokeeCheyenneChickasawChileanChineseChippewaChoctawColvilleComancheCosta RicanCreeCreekCroatianCrowCubanCypriotCzechCzechoslovakianDanishDelawareDominicanDutchDutch West IndianEastern EuropeanEcuadorianEgyptianEnglishEstonianEthiopianEuropeanFijianFilipinoFinnishFrenchFrench American IndianFrench CanadianGermanGerman RussianGhanaianGreekGuamanian/ChamorroGuatemalanGuyaneseHaitianHmongHonduranHopiHoumaHungarianIcelanderIndian (Asian)IndonesianInupiatIranianIraqiIrishIroquoisIsraeliItalianJamaicanJapaneseJordanianKenyanKiowaKoreanLaotianLatvianLebaneseLiberianLithuanianLumbeeLuxembourgerMacedonianMalaysianMalteseMarshalleseMenomineeMexicanMexican American IndianMongolianMoroccanNative HawaiianNavajoNepaleseNew ZealanderNicaraguanNigerianNorthern EuropeanNorwegianOkinawanOsageOttawaPaiutePakistaniPalestinianPanamanianParaguayanPennsylvania GermanPeruvianPimaPolishPortuguesePotawatomiPuebloPuerto RicanPuget Sound SalishRomanianRussianSalvadoranSamoanScandinavianScotch-IrishScottishSeminoleSenegaleseSerbianShoshoneSierra LeoneanSiouxSlavicSlovakSloveneSomaliSouth AfricanSouth AmericanSouth American IndianSoviet UnionSpaniardSpanishSpanish AmericanSpanish American IndianSri LankanSubsaharan AfricanSudaneseSwedishSwissSyrianTaiwaneseThaiTlingit-HaidaTohono O'OdhamTonganTrinidadian and TobagonianTsimshianTurkishU.S. Virgin IslanderUgandanUkrainianUruguayanUteVenezuelanVietnameseWelshWest IndianYakamaYaquiYugoslavianYumanYup'ikZimbabwean
Immigration
NonimmigrantsImmigrantsAfghanistanAfricaAlbaniaArgentinaArmeniaAsiaAustraliaAustriaBahamasBangladeshBarbadosBelarusBelgiumBelizeBoliviaBosnia and HerzegovinaBrazilBulgariaBurma/MyanmarCabo VerdeCambodiaCameroonCanadaCaribbeanCentral AmericaChileChinaColombiaCongoCosta RicaCroatiaCubaCzechoslovakiaDenmarkDominicaDominican RepublicEastern AfricaEastern AsiaEastern EuropeEcuadorEgyptEl SalvadorEnglandEritreaEthiopiaEuropeFijiFranceGermanyGhanaGreeceGrenadaGuatemalaGuyanaHaitiHondurasHong KongHungaryIndiaIndonesiaIranIraqIrelandIsraelItalyJamaicaJapanJordanKazakhstanKenyaKoreaKuwaitLaosLatin AmericaLatviaLebanonLiberiaLithuaniaMalaysiaMexicoMicronesiaMiddle AfricaMoldovaMoroccoNepalNetherlandsNicaraguaNigeriaNorth AmericaNorth MacedoniaNorthern AfricaNorthern EuropeNorwayOceaniaPakistanPanamaPeruPhilippinesPolandPortugalRomaniaRussiaSaudi ArabiaScotlandSenegalSerbiaSierra LeoneSingaporeSomaliaSouth AfricaSouth AmericaSouth Central AsiaSouth Eastern AsiaSouthern EuropeSpainSri LankaSt. Vincent and the GrenadinesSudanSwedenSwitzerlandSyriaTaiwanThailandTrinidad and TobagoTurkeyUgandaUkraineUruguayUzbekistanVenezuelaVietnamWest IndiesWestern AfricaWestern AsiaWestern EuropeYemenZaireZimbabweAzores
Family Households with Children
Income
Poverty
Unemployment
Labor Participation
Family Structure
Vehicle Availability
Education Level
Disability

Family Households with Children Comparison

Colombians

Apache

Exceptional
Exceptional
28.3%
FAMILY HOUSEHOLDS WITH CHILDREN
99.6/ 100
METRIC RATING
87th/ 347
METRIC RANK
29.0%
FAMILY HOUSEHOLDS WITH CHILDREN
100.0/ 100
METRIC RATING
48th/ 347
METRIC RANK

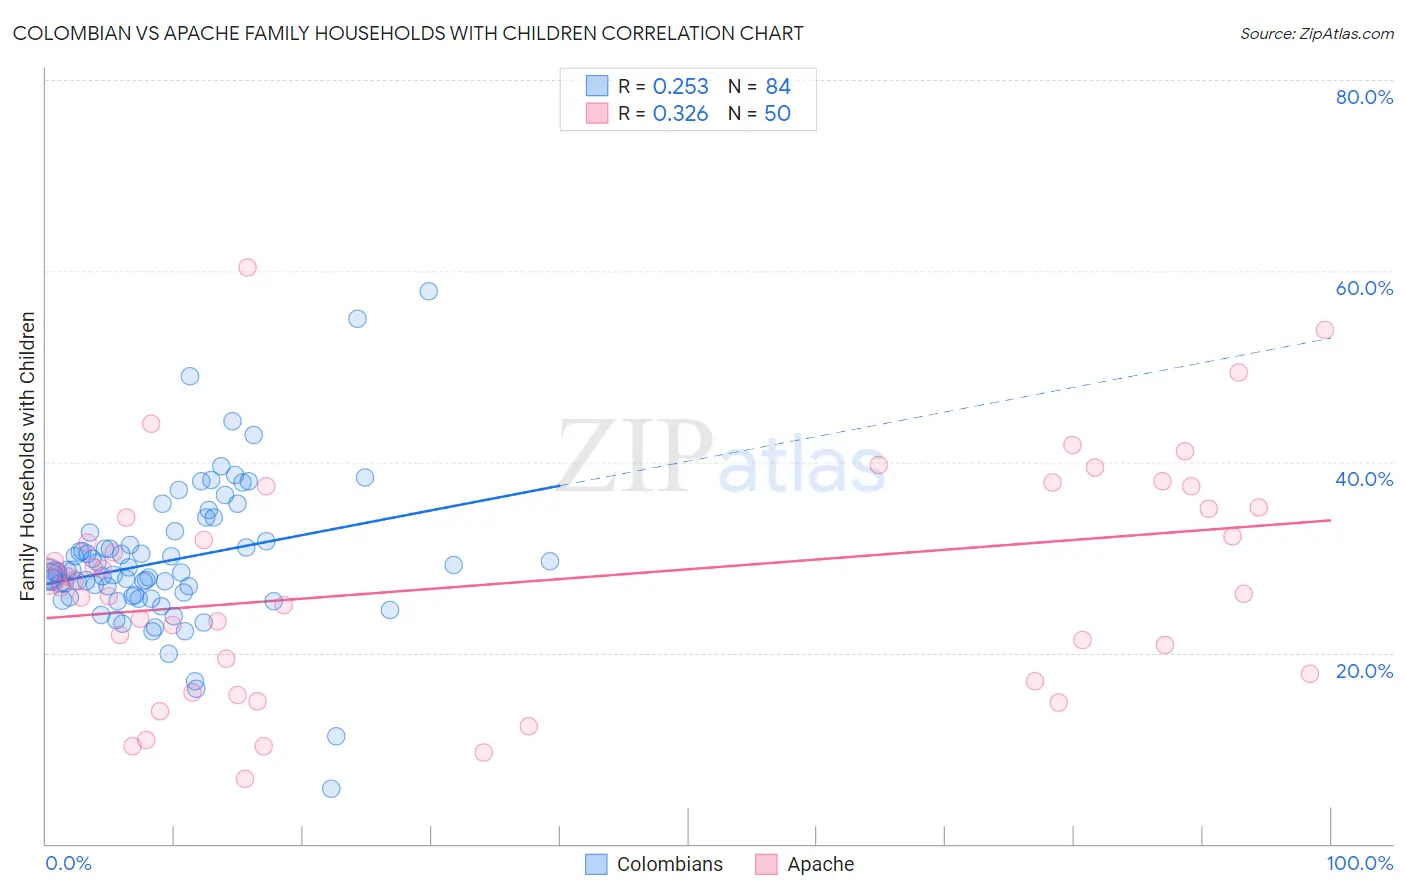
Colombian vs Apache Family Households with Children Correlation Chart

The statistical analysis conducted on geographies consisting of 419,165,889 people shows a weak positive correlation between the proportion of Colombians and percentage of family households with children in the United States with a correlation coefficient (R) of 0.253 and weighted average of 28.3%. Similarly, the statistical analysis conducted on geographies consisting of 231,023,024 people shows a mild positive correlation between the proportion of Apache and percentage of family households with children in the United States with a correlation coefficient (R) of 0.326 and weighted average of 29.0%, a difference of 2.5%.
Colombian vs Apache Family Households with Children

Family Households with Children Correlation Summary

MeasurementColombianApache
Minimum5.7%6.8%
Maximum57.9%60.3%
Range52.2%53.6%
Mean29.7%27.5%
Median28.4%27.2%
Interquartile 25% (IQ1)25.9%17.8%
Interquartile 75% (IQ3)32.1%35.2%
Interquartile Range (IQR)6.3%17.4%
Standard Deviation (Sample)7.7%11.9%
Standard Deviation (Population)7.7%11.8%

Similar Demographics by Family Households with Children

Demographics Similar to Colombians by Family Households with Children

In terms of family households with children, the demographic groups most similar to Colombians are Liberian (28.3%, a difference of 0.010%), Immigrants from Costa Rica (28.3%, a difference of 0.020%), Immigrants from Western Africa (28.3%, a difference of 0.060%), Immigrants from Thailand (28.2%, a difference of 0.13%), and Immigrants from Liberia (28.2%, a difference of 0.18%).
DemographicsRating | RankFamily Households with Children
Natives/Alaskans
99.8
/100
|
#80
Exceptional
28.4%
South Americans
99.8
/100
|
#81
Exceptional
28.4%
Kenyans
99.8
/100
|
#82
Exceptional
28.4%
Nicaraguans
99.8
/100
|
#83
Exceptional
28.4%
Costa Ricans
99.8
/100
|
#84
Exceptional
28.4%
Immigrants | Syria
99.8
/100
|
#85
Exceptional
28.4%
Immigrants | Western Africa
99.6
/100
|
#86
Exceptional
28.3%
Colombians
99.6
/100
|
#87
Exceptional
28.3%
Liberians
99.6
/100
|
#88
Exceptional
28.3%
Immigrants | Costa Rica
99.6
/100
|
#89
Exceptional
28.3%
Immigrants | Thailand
99.5
/100
|
#90
Exceptional
28.2%
Immigrants | Liberia
99.4
/100
|
#91
Exceptional
28.2%
Chickasaw
99.4
/100
|
#92
Exceptional
28.2%
Panamanians
99.3
/100
|
#93
Exceptional
28.2%
Immigrants | Colombia
99.2
/100
|
#94
Exceptional
28.2%

Demographics Similar to Apache by Family Households with Children

In terms of family households with children, the demographic groups most similar to Apache are Peruvian (29.0%, a difference of 0.030%), Immigrants from Philippines (29.0%, a difference of 0.040%), Jordanian (29.0%, a difference of 0.090%), Fijian (29.0%, a difference of 0.13%), and Immigrants from Taiwan (29.0%, a difference of 0.18%).
DemographicsRating | RankFamily Households with Children
Immigrants | South Eastern Asia
100.0
/100
|
#41
Exceptional
29.1%
Spanish American Indians
100.0
/100
|
#42
Exceptional
29.1%
Asians
100.0
/100
|
#43
Exceptional
29.1%
Immigrants | Taiwan
100.0
/100
|
#44
Exceptional
29.0%
Fijians
100.0
/100
|
#45
Exceptional
29.0%
Immigrants | Philippines
100.0
/100
|
#46
Exceptional
29.0%
Peruvians
100.0
/100
|
#47
Exceptional
29.0%
Apache
100.0
/100
|
#48
Exceptional
29.0%
Jordanians
100.0
/100
|
#49
Exceptional
29.0%
Immigrants | Immigrants
100.0
/100
|
#50
Exceptional
28.9%
Immigrants | Peru
100.0
/100
|
#51
Exceptional
28.9%
Guatemalans
100.0
/100
|
#52
Exceptional
28.9%
Immigrants | Cambodia
100.0
/100
|
#53
Exceptional
28.9%
Sierra Leoneans
100.0
/100
|
#54
Exceptional
28.9%
Immigrants | Asia
100.0
/100
|
#55
Exceptional
28.8%