Puerto Rican vs Immigrants from India Births to Unmarried Women

COMPARE

Puerto Rican
Race
Ancestry
AfghanAfricanAlaska NativeAlaskan AthabascanAlbanianAleutAlsatianAmericanApacheArabArapahoArgentineanArmenianAssyrian/Chaldean/SyriacAustralianAustrianBahamianBangladeshiBarbadianBasqueBelgianBelizeanBermudanBhutaneseBlackfeetBolivianBrazilianBritishBritish West IndianBulgarianBurmeseCajunCambodianCanadianCape VerdeanCarpatho RusynCelticCentral AmericanCentral American IndianCherokeeCheyenneChickasawChileanChineseChippewaChoctawColombianColvilleComancheCosta RicanCreeCreekCroatianCrowCubanCypriotCzechCzechoslovakianDanishDelawareDominicanDutchDutch West IndianEastern EuropeanEcuadorianEgyptianEnglishEstonianEthiopianEuropeanFijianFilipinoFinnishFrenchFrench American IndianFrench CanadianGermanGerman RussianGhanaianGreekGuamanian/ChamorroGuatemalanGuyaneseHaitianHmongHonduranHopiHoumaHungarianIcelanderIndian (Asian)IndonesianInupiatIranianIraqiIrishIroquoisIsraeliItalianJamaicanJapaneseJordanianKenyanKiowaKoreanLaotianLatvianLebaneseLiberianLithuanianLumbeeLuxembourgerMacedonianMalaysianMalteseMarshalleseMenomineeMexicanMexican American IndianMongolianMoroccanNative HawaiianNavajoNepaleseNew ZealanderNicaraguanNigerianNorthern EuropeanNorwegianOkinawanOsageOttawaPaiutePakistaniPalestinianPanamanianParaguayanPennsylvania GermanPeruvianPimaPolishPortuguesePotawatomiPuebloPuerto RicanPuget Sound SalishRomanianRussianSalvadoranSamoanScandinavianScotch-IrishScottishSeminoleSenegaleseSerbianShoshoneSierra LeoneanSiouxSlavicSlovakSloveneSomaliSouth AfricanSouth AmericanSouth American IndianSoviet UnionSpaniardSpanishSpanish AmericanSpanish American IndianSri LankanSubsaharan AfricanSudaneseSwedishSwissSyrianTaiwaneseThaiTlingit-HaidaTohono O'OdhamTonganTrinidadian and TobagonianTsimshianTurkishU.S. Virgin IslanderUgandanUkrainianUruguayanUteVenezuelanVietnameseWelshWest IndianYakamaYaquiYugoslavianYumanYup'ikZimbabwean
Immigration
NonimmigrantsImmigrantsAfghanistanAfricaAlbaniaArgentinaArmeniaAsiaAustraliaAustriaBahamasBangladeshBarbadosBelarusBelgiumBelizeBoliviaBosnia and HerzegovinaBrazilBulgariaBurma/MyanmarCabo VerdeCambodiaCameroonCanadaCaribbeanCentral AmericaChileChinaColombiaCongoCosta RicaCroatiaCubaCzechoslovakiaDenmarkDominicaDominican RepublicEastern AfricaEastern AsiaEastern EuropeEcuadorEgyptEl SalvadorEnglandEritreaEthiopiaEuropeFijiFranceGermanyGhanaGreeceGrenadaGuatemalaGuyanaHaitiHondurasHong KongHungaryIndonesiaIranIraqIrelandIsraelItalyJamaicaJapanJordanKazakhstanKenyaKoreaKuwaitLaosLatin AmericaLatviaLebanonLiberiaLithuaniaMalaysiaMexicoMicronesiaMiddle AfricaMoldovaMoroccoNepalNetherlandsNicaraguaNigeriaNorth AmericaNorth MacedoniaNorthern AfricaNorthern EuropeNorwayOceaniaPakistanPanamaPeruPhilippinesPolandPortugalRomaniaRussiaSaudi ArabiaScotlandSenegalSerbiaSierra LeoneSingaporeSomaliaSouth AfricaSouth AmericaSouth Central AsiaSouth Eastern AsiaSouthern EuropeSpainSri LankaSt. Vincent and the GrenadinesSudanSwedenSwitzerlandSyriaTaiwanThailandTrinidad and TobagoTurkeyUgandaUkraineUruguayUzbekistanVenezuelaVietnamWest IndiesWestern AfricaWestern AsiaWestern EuropeYemenZaireZimbabweAzores
Immigrants from India
Race
Ancestry
AfghanAfricanAlaska NativeAlaskan AthabascanAlbanianAleutAlsatianAmericanApacheArabArapahoArgentineanArmenianAssyrian/Chaldean/SyriacAustralianAustrianBahamianBangladeshiBarbadianBasqueBelgianBelizeanBermudanBhutaneseBlackfeetBolivianBrazilianBritishBritish West IndianBulgarianBurmeseCajunCambodianCanadianCape VerdeanCarpatho RusynCelticCentral AmericanCentral American IndianCherokeeCheyenneChickasawChileanChineseChippewaChoctawColombianColvilleComancheCosta RicanCreeCreekCroatianCrowCubanCypriotCzechCzechoslovakianDanishDelawareDominicanDutchDutch West IndianEastern EuropeanEcuadorianEgyptianEnglishEstonianEthiopianEuropeanFijianFilipinoFinnishFrenchFrench American IndianFrench CanadianGermanGerman RussianGhanaianGreekGuamanian/ChamorroGuatemalanGuyaneseHaitianHmongHonduranHopiHoumaHungarianIcelanderIndian (Asian)IndonesianInupiatIranianIraqiIrishIroquoisIsraeliItalianJamaicanJapaneseJordanianKenyanKiowaKoreanLaotianLatvianLebaneseLiberianLithuanianLumbeeLuxembourgerMacedonianMalaysianMalteseMarshalleseMenomineeMexicanMexican American IndianMongolianMoroccanNative HawaiianNavajoNepaleseNew ZealanderNicaraguanNigerianNorthern EuropeanNorwegianOkinawanOsageOttawaPaiutePakistaniPalestinianPanamanianParaguayanPennsylvania GermanPeruvianPimaPolishPortuguesePotawatomiPuebloPuget Sound SalishRomanianRussianSalvadoranSamoanScandinavianScotch-IrishScottishSeminoleSenegaleseSerbianShoshoneSierra LeoneanSiouxSlavicSlovakSloveneSomaliSouth AfricanSouth AmericanSouth American IndianSoviet UnionSpaniardSpanishSpanish AmericanSpanish American IndianSri LankanSubsaharan AfricanSudaneseSwedishSwissSyrianTaiwaneseThaiTlingit-HaidaTohono O'OdhamTonganTrinidadian and TobagonianTsimshianTurkishU.S. Virgin IslanderUgandanUkrainianUruguayanUteVenezuelanVietnameseWelshWest IndianYakamaYaquiYugoslavianYumanYup'ikZimbabwean
Immigration
NonimmigrantsImmigrantsAfghanistanAfricaAlbaniaArgentinaArmeniaAsiaAustraliaAustriaBahamasBangladeshBarbadosBelarusBelgiumBelizeBoliviaBosnia and HerzegovinaBrazilBulgariaBurma/MyanmarCabo VerdeCambodiaCameroonCanadaCaribbeanCentral AmericaChileChinaColombiaCongoCosta RicaCroatiaCubaCzechoslovakiaDenmarkDominicaDominican RepublicEastern AfricaEastern AsiaEastern EuropeEcuadorEgyptEl SalvadorEnglandEritreaEthiopiaEuropeFijiFranceGermanyGhanaGreeceGrenadaGuatemalaGuyanaHaitiHondurasHong KongHungaryIndiaIndonesiaIranIraqIrelandIsraelItalyJamaicaJapanJordanKazakhstanKenyaKoreaKuwaitLaosLatin AmericaLatviaLebanonLiberiaLithuaniaMalaysiaMexicoMicronesiaMiddle AfricaMoldovaMoroccoNepalNetherlandsNicaraguaNigeriaNorth AmericaNorth MacedoniaNorthern AfricaNorthern EuropeNorwayOceaniaPakistanPanamaPeruPhilippinesPolandPortugalRomaniaRussiaSaudi ArabiaScotlandSenegalSerbiaSierra LeoneSingaporeSomaliaSouth AfricaSouth AmericaSouth Central AsiaSouth Eastern AsiaSouthern EuropeSpainSri LankaSt. Vincent and the GrenadinesSudanSwedenSwitzerlandSyriaTaiwanThailandTrinidad and TobagoTurkeyUgandaUkraineUruguayUzbekistanVenezuelaVietnamWest IndiesWestern AfricaWestern AsiaWestern EuropeYemenZaireZimbabweAzores
Births to Unmarried Women
Income
Poverty
Unemployment
Labor Participation
Family Structure
Vehicle Availability
Education Level
Disability

Births to Unmarried Women Comparison

Puerto Ricans

Immigrants from India

Tragic
Exceptional
45.7%
BIRTHS TO UNMARRIED WOMEN
0.0/ 100
METRIC RATING
336th/ 347
METRIC RANK
22.9%
BIRTHS TO UNMARRIED WOMEN
100.0/ 100
METRIC RATING
2nd/ 347
METRIC RANK

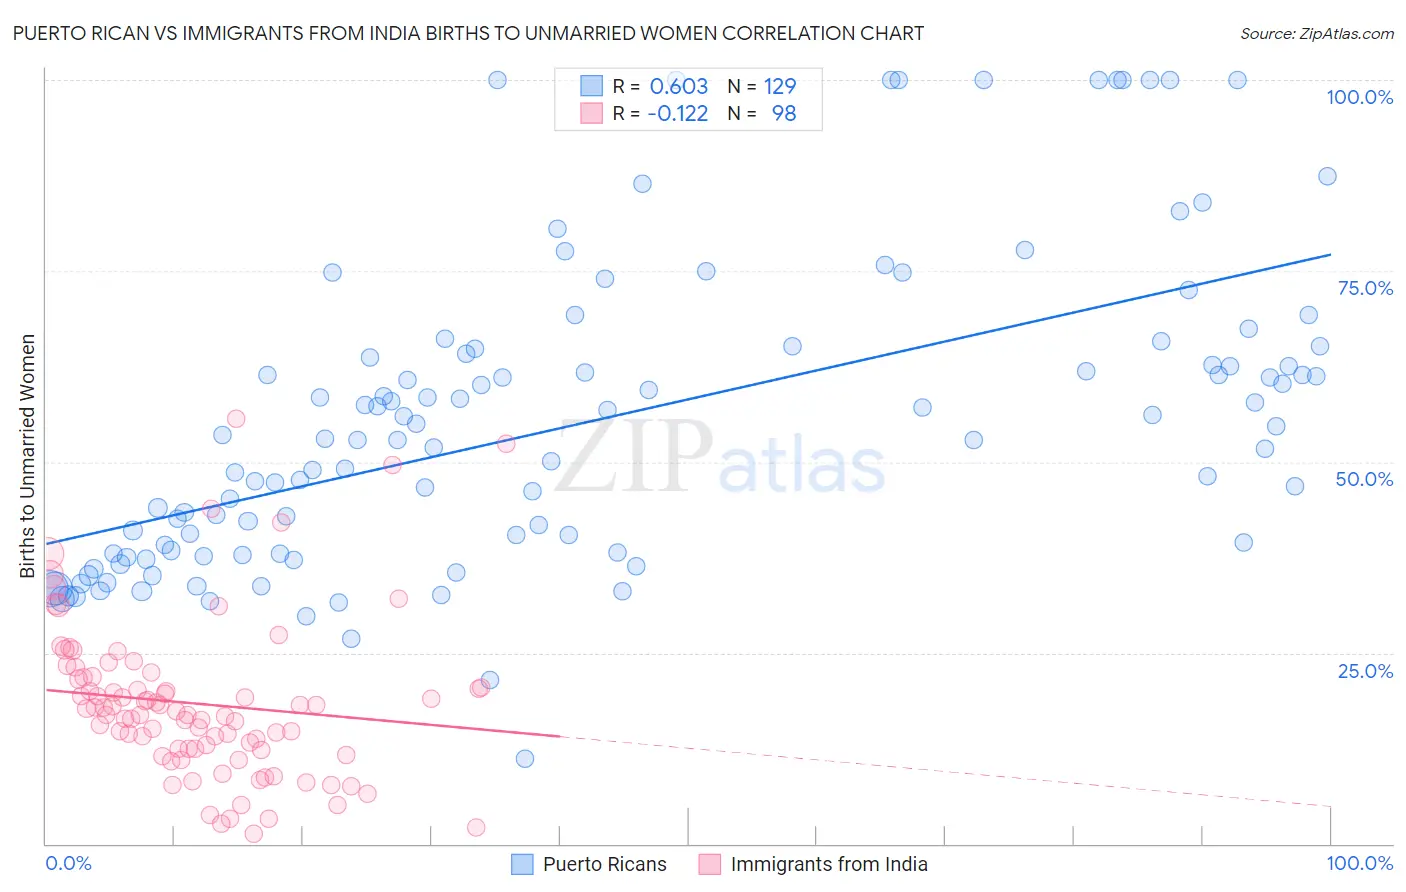
Puerto Rican vs Immigrants from India Births to Unmarried Women Correlation Chart

The statistical analysis conducted on geographies consisting of 481,236,419 people shows a significant positive correlation between the proportion of Puerto Ricans and percentage of births to unmarried women in the United States with a correlation coefficient (R) of 0.603 and weighted average of 45.7%. Similarly, the statistical analysis conducted on geographies consisting of 401,508,403 people shows a poor negative correlation between the proportion of Immigrants from India and percentage of births to unmarried women in the United States with a correlation coefficient (R) of -0.122 and weighted average of 22.9%, a difference of 99.5%.
Puerto Rican vs Immigrants from India Births to Unmarried Women

Births to Unmarried Women Correlation Summary

MeasurementPuerto RicanImmigrants from India
Minimum11.1%1.3%
Maximum100.0%55.7%
Range88.9%54.4%
Mean55.2%18.3%
Median53.0%17.1%
Interquartile 25% (IQ1)38.0%12.4%
Interquartile 75% (IQ3)64.5%21.8%
Interquartile Range (IQR)26.5%9.4%
Standard Deviation (Sample)20.1%10.3%
Standard Deviation (Population)20.0%10.3%

Similar Demographics by Births to Unmarried Women

Demographics Similar to Puerto Ricans by Births to Unmarried Women

In terms of births to unmarried women, the demographic groups most similar to Puerto Ricans are Colville (45.3%, a difference of 0.78%), Houma (46.6%, a difference of 1.9%), Yuman (44.4%, a difference of 2.9%), Black/African American (44.3%, a difference of 3.1%), and Arapaho (47.1%, a difference of 3.2%).
DemographicsRating | RankBirths to Unmarried Women
Paiute
0.0
/100
|
#329
Tragic
42.5%
Chippewa
0.0
/100
|
#330
Tragic
42.6%
Natives/Alaskans
0.0
/100
|
#331
Tragic
43.0%
Kiowa
0.0
/100
|
#332
Tragic
43.1%
Blacks/African Americans
0.0
/100
|
#333
Tragic
44.3%
Yuman
0.0
/100
|
#334
Tragic
44.4%
Colville
0.0
/100
|
#335
Tragic
45.3%
Puerto Ricans
0.0
/100
|
#336
Tragic
45.7%
Houma
0.0
/100
|
#337
Tragic
46.6%
Arapaho
0.0
/100
|
#338
Tragic
47.1%
Lumbee
0.0
/100
|
#339
Tragic
48.2%
Tohono O'odham
0.0
/100
|
#340
Tragic
49.8%
Hopi
0.0
/100
|
#341
Tragic
50.8%
Menominee
0.0
/100
|
#342
Tragic
51.1%
Pima
0.0
/100
|
#343
Tragic
51.5%

Demographics Similar to Immigrants from India by Births to Unmarried Women

In terms of births to unmarried women, the demographic groups most similar to Immigrants from India are Filipino (23.0%, a difference of 0.38%), Immigrants from Taiwan (23.0%, a difference of 0.52%), Immigrants from Hong Kong (23.6%, a difference of 3.0%), Assyrian/Chaldean/Syriac (22.0%, a difference of 4.2%), and Immigrants from Iran (24.0%, a difference of 4.6%).
DemographicsRating | RankBirths to Unmarried Women
Assyrians/Chaldeans/Syriacs
100.0
/100
|
#1
Exceptional
22.0%
Immigrants | India
100.0
/100
|
#2
Exceptional
22.9%
Filipinos
100.0
/100
|
#3
Exceptional
23.0%
Immigrants | Taiwan
100.0
/100
|
#4
Exceptional
23.0%
Immigrants | Hong Kong
100.0
/100
|
#5
Exceptional
23.6%
Immigrants | Iran
100.0
/100
|
#6
Exceptional
24.0%
Thais
100.0
/100
|
#7
Exceptional
24.0%
Immigrants | China
100.0
/100
|
#8
Exceptional
24.7%
Immigrants | South Central Asia
100.0
/100
|
#9
Exceptional
24.7%
Immigrants | Eastern Asia
100.0
/100
|
#10
Exceptional
25.0%
Immigrants | Israel
100.0
/100
|
#11
Exceptional
25.1%
Indians (Asian)
100.0
/100
|
#12
Exceptional
25.3%
Iranians
100.0
/100
|
#13
Exceptional
25.3%
Immigrants | Lebanon
100.0
/100
|
#14
Exceptional
25.3%
Immigrants | Singapore
100.0
/100
|
#15
Exceptional
25.6%