Kiowa vs Immigrants from Ghana Births to Unmarried Women
COMPARE
Kiowa
Immigrants from Ghana
Births to Unmarried Women
Births to Unmarried Women Comparison
Kiowa
Immigrants from Ghana
43.1%
BIRTHS TO UNMARRIED WOMEN
0.0/ 100
METRIC RATING
332nd/ 347
METRIC RANK
34.5%
BIRTHS TO UNMARRIED WOMEN
2.2/ 100
METRIC RATING
235th/ 347
METRIC RANK
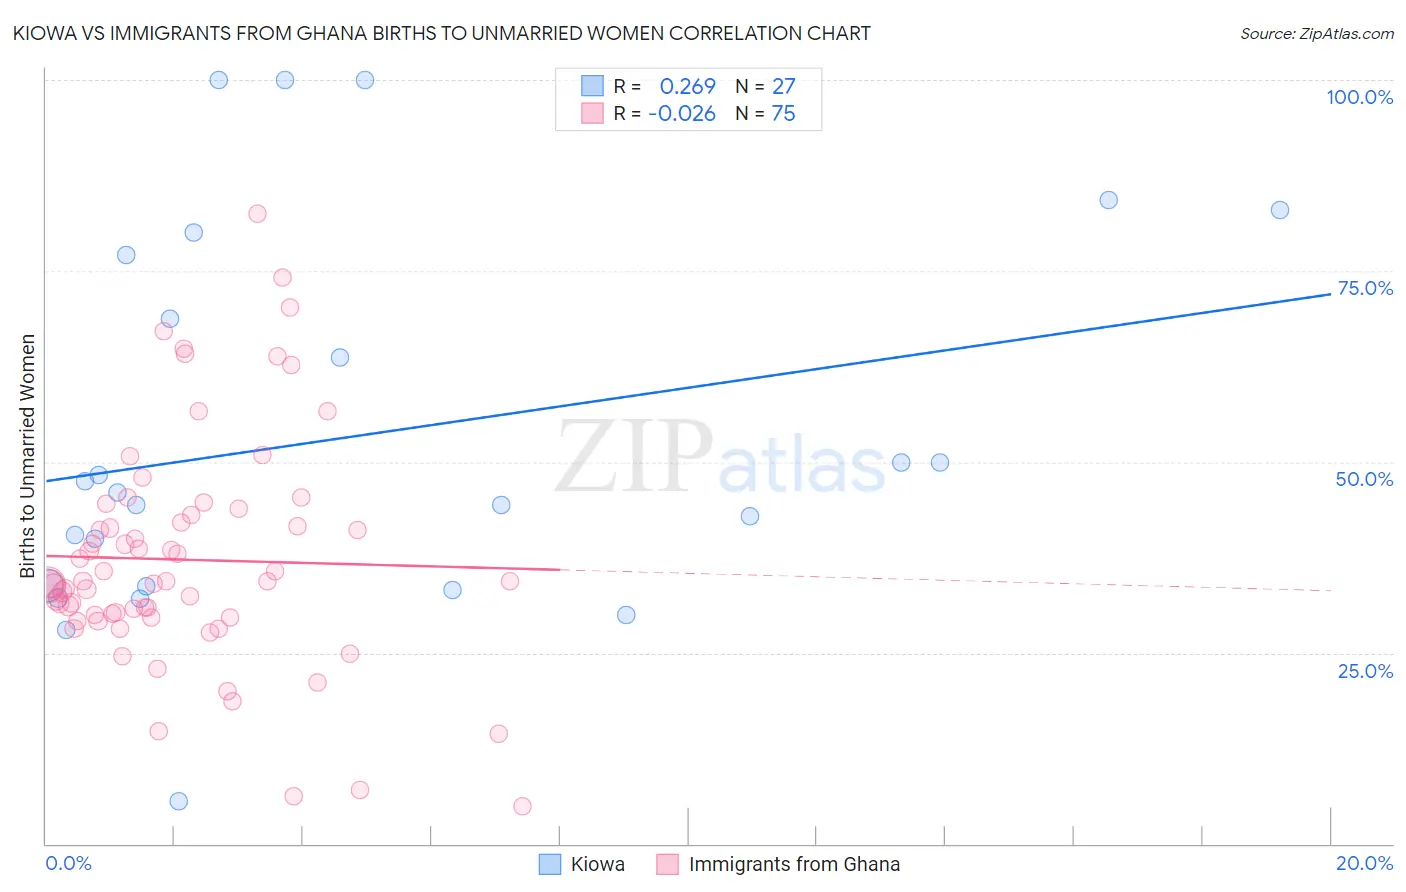
Kiowa vs Immigrants from Ghana Births to Unmarried Women Correlation Chart
The statistical analysis conducted on geographies consisting of 55,598,383 people shows a weak positive correlation between the proportion of Kiowa and percentage of births to unmarried women in the United States with a correlation coefficient (R) of 0.269 and weighted average of 43.1%. Similarly, the statistical analysis conducted on geographies consisting of 193,200,856 people shows no correlation between the proportion of Immigrants from Ghana and percentage of births to unmarried women in the United States with a correlation coefficient (R) of -0.026 and weighted average of 34.5%, a difference of 25.0%.
Births to Unmarried Women Correlation Summary
| Measurement | Kiowa | Immigrants from Ghana |
| Minimum | 5.6% | 4.9% |
| Maximum | 100.0% | 82.5% |
| Range | 94.4% | 77.6% |
| Mean | 53.3% | 37.2% |
| Median | 46.0% | 34.4% |
| Interquartile 25% (IQ1) | 33.8% | 29.7% |
| Interquartile 75% (IQ3) | 77.0% | 43.0% |
| Interquartile Range (IQR) | 43.2% | 13.3% |
| Standard Deviation (Sample) | 25.0% | 14.9% |
| Standard Deviation (Population) | 24.5% | 14.8% |
Similar Demographics by Births to Unmarried Women
Demographics Similar to Kiowa by Births to Unmarried Women
In terms of births to unmarried women, the demographic groups most similar to Kiowa are Native/Alaskan (43.0%, a difference of 0.35%), Chippewa (42.6%, a difference of 1.2%), Paiute (42.5%, a difference of 1.6%), Immigrants from Cabo Verde (42.2%, a difference of 2.2%), and Tsimshian (42.2%, a difference of 2.3%).
| Demographics | Rating | Rank | Births to Unmarried Women |
| Cheyenne | 0.0 /100 | #325 | Tragic 41.3% |
| Immigrants | Cuba | 0.0 /100 | #326 | Tragic 41.5% |
| Tsimshian | 0.0 /100 | #327 | Tragic 42.2% |
| Immigrants | Cabo Verde | 0.0 /100 | #328 | Tragic 42.2% |
| Paiute | 0.0 /100 | #329 | Tragic 42.5% |
| Chippewa | 0.0 /100 | #330 | Tragic 42.6% |
| Natives/Alaskans | 0.0 /100 | #331 | Tragic 43.0% |
| Kiowa | 0.0 /100 | #332 | Tragic 43.1% |
| Blacks/African Americans | 0.0 /100 | #333 | Tragic 44.3% |
| Yuman | 0.0 /100 | #334 | Tragic 44.4% |
| Colville | 0.0 /100 | #335 | Tragic 45.3% |
| Puerto Ricans | 0.0 /100 | #336 | Tragic 45.7% |
| Houma | 0.0 /100 | #337 | Tragic 46.6% |
| Arapaho | 0.0 /100 | #338 | Tragic 47.1% |
| Lumbee | 0.0 /100 | #339 | Tragic 48.2% |
Demographics Similar to Immigrants from Ghana by Births to Unmarried Women
In terms of births to unmarried women, the demographic groups most similar to Immigrants from Ghana are Immigrants from Zaire (34.5%, a difference of 0.070%), Bangladeshi (34.4%, a difference of 0.31%), French Canadian (34.4%, a difference of 0.33%), Native Hawaiian (34.3%, a difference of 0.62%), and Immigrants from Cameroon (34.7%, a difference of 0.63%).
| Demographics | Rating | Rank | Births to Unmarried Women |
| Panamanians | 3.3 /100 | #228 | Tragic 34.2% |
| Immigrants | Sierra Leone | 3.1 /100 | #229 | Tragic 34.2% |
| Ghanaians | 3.1 /100 | #230 | Tragic 34.3% |
| Native Hawaiians | 2.9 /100 | #231 | Tragic 34.3% |
| French Canadians | 2.5 /100 | #232 | Tragic 34.4% |
| Bangladeshis | 2.5 /100 | #233 | Tragic 34.4% |
| Immigrants | Zaire | 2.3 /100 | #234 | Tragic 34.5% |
| Immigrants | Ghana | 2.2 /100 | #235 | Tragic 34.5% |
| Immigrants | Cameroon | 1.6 /100 | #236 | Tragic 34.7% |
| Marshallese | 1.6 /100 | #237 | Tragic 34.8% |
| Immigrants | Cambodia | 1.6 /100 | #238 | Tragic 34.8% |
| Sierra Leoneans | 1.4 /100 | #239 | Tragic 34.9% |
| Immigrants | Middle Africa | 1.2 /100 | #240 | Tragic 34.9% |
| Immigrants | Guyana | 1.2 /100 | #241 | Tragic 35.0% |
| Indonesians | 1.2 /100 | #242 | Tragic 35.0% |