Japanese vs South American Indian Births to Unmarried Women
COMPARE
Japanese
South American Indian
Births to Unmarried Women
Births to Unmarried Women Comparison
Japanese
South American Indians
35.2%
BIRTHS TO UNMARRIED WOMEN
0.9/ 100
METRIC RATING
243rd/ 347
METRIC RANK
31.7%
BIRTHS TO UNMARRIED WOMEN
47.7/ 100
METRIC RATING
177th/ 347
METRIC RANK
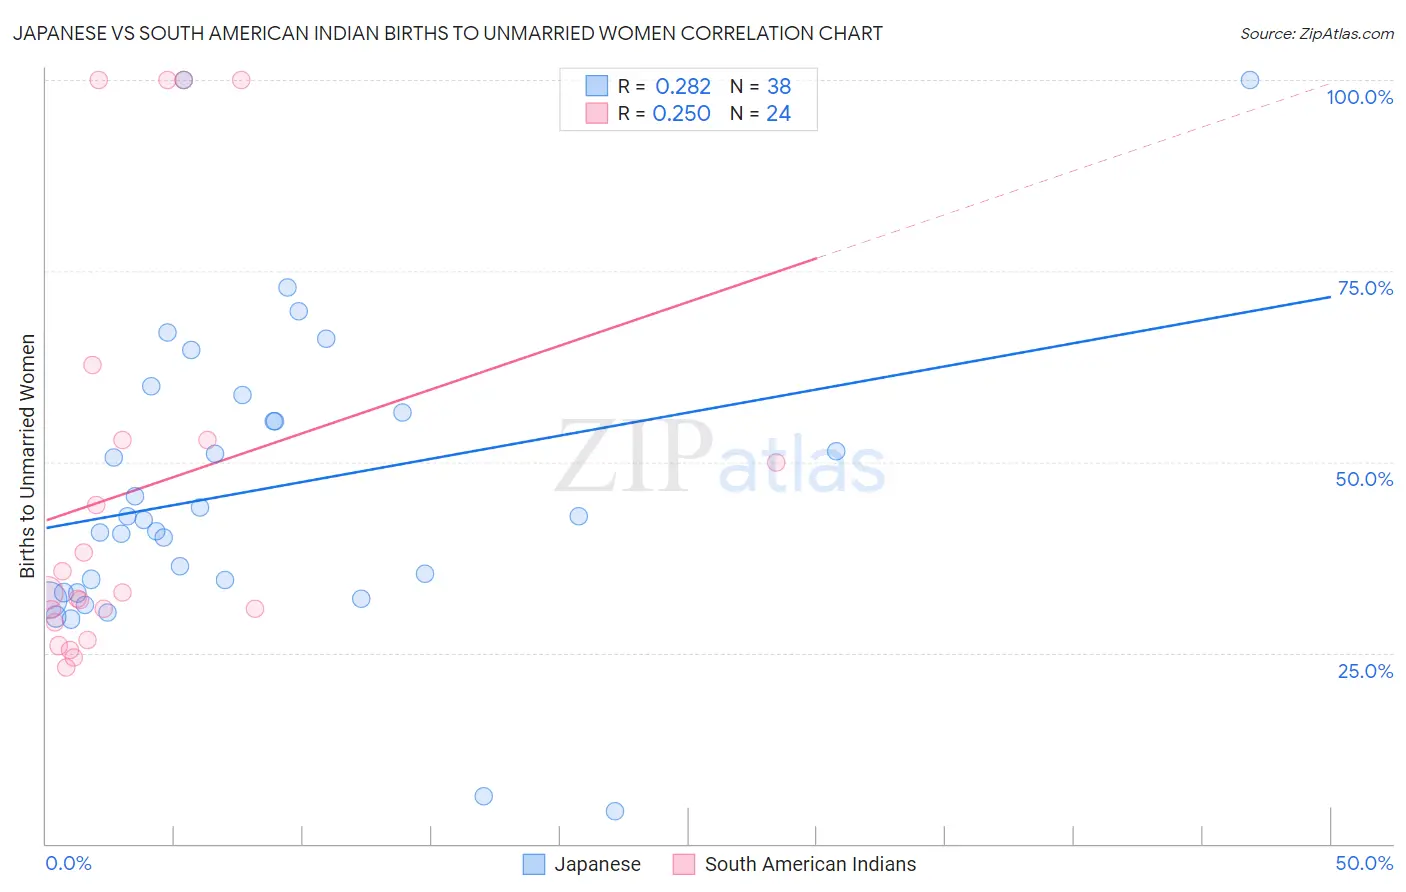
Japanese vs South American Indian Births to Unmarried Women Correlation Chart
The statistical analysis conducted on geographies consisting of 240,312,984 people shows a weak positive correlation between the proportion of Japanese and percentage of births to unmarried women in the United States with a correlation coefficient (R) of 0.282 and weighted average of 35.2%. Similarly, the statistical analysis conducted on geographies consisting of 159,564,044 people shows a weak positive correlation between the proportion of South American Indians and percentage of births to unmarried women in the United States with a correlation coefficient (R) of 0.250 and weighted average of 31.7%, a difference of 10.8%.
Births to Unmarried Women Correlation Summary
| Measurement | Japanese | South American Indian |
| Minimum | 4.3% | 23.0% |
| Maximum | 100.0% | 100.0% |
| Range | 95.7% | 77.0% |
| Mean | 46.3% | 46.4% |
| Median | 42.6% | 32.9% |
| Interquartile 25% (IQ1) | 32.9% | 29.9% |
| Interquartile 75% (IQ3) | 56.4% | 52.9% |
| Interquartile Range (IQR) | 23.5% | 23.0% |
| Standard Deviation (Sample) | 19.9% | 26.5% |
| Standard Deviation (Population) | 19.7% | 25.9% |
Similar Demographics by Births to Unmarried Women
Demographics Similar to Japanese by Births to Unmarried Women
In terms of births to unmarried women, the demographic groups most similar to Japanese are Guyanese (35.2%, a difference of 0.060%), Shoshone (35.3%, a difference of 0.40%), Indonesian (35.0%, a difference of 0.49%), Nigerian (35.3%, a difference of 0.51%), and Immigrants from Guyana (35.0%, a difference of 0.59%).
| Demographics | Rating | Rank | Births to Unmarried Women |
| Immigrants | Cameroon | 1.6 /100 | #236 | Tragic 34.7% |
| Marshallese | 1.6 /100 | #237 | Tragic 34.8% |
| Immigrants | Cambodia | 1.6 /100 | #238 | Tragic 34.8% |
| Sierra Leoneans | 1.4 /100 | #239 | Tragic 34.9% |
| Immigrants | Middle Africa | 1.2 /100 | #240 | Tragic 34.9% |
| Immigrants | Guyana | 1.2 /100 | #241 | Tragic 35.0% |
| Indonesians | 1.2 /100 | #242 | Tragic 35.0% |
| Japanese | 0.9 /100 | #243 | Tragic 35.2% |
| Guyanese | 0.9 /100 | #244 | Tragic 35.2% |
| Shoshone | 0.8 /100 | #245 | Tragic 35.3% |
| Nigerians | 0.7 /100 | #246 | Tragic 35.3% |
| Immigrants | Nigeria | 0.7 /100 | #247 | Tragic 35.4% |
| Immigrants | Nonimmigrants | 0.6 /100 | #248 | Tragic 35.5% |
| Bermudans | 0.6 /100 | #249 | Tragic 35.5% |
| Mexican American Indians | 0.4 /100 | #250 | Tragic 35.7% |
Demographics Similar to South American Indians by Births to Unmarried Women
In terms of births to unmarried women, the demographic groups most similar to South American Indians are English (31.7%, a difference of 0.030%), Scottish (31.7%, a difference of 0.040%), South American (31.8%, a difference of 0.070%), Immigrants from Venezuela (31.7%, a difference of 0.14%), and Moroccan (31.8%, a difference of 0.18%).
| Demographics | Rating | Rank | Births to Unmarried Women |
| Guamanians/Chamorros | 51.3 /100 | #170 | Average 31.6% |
| Finns | 50.5 /100 | #171 | Average 31.7% |
| Immigrants | Eritrea | 50.4 /100 | #172 | Average 31.7% |
| Immigrants | Yemen | 50.2 /100 | #173 | Average 31.7% |
| Venezuelans | 50.0 /100 | #174 | Average 31.7% |
| Immigrants | Venezuela | 49.2 /100 | #175 | Average 31.7% |
| Scottish | 48.1 /100 | #176 | Average 31.7% |
| South American Indians | 47.7 /100 | #177 | Average 31.7% |
| English | 47.4 /100 | #178 | Average 31.7% |
| South Americans | 46.9 /100 | #179 | Average 31.8% |
| Moroccans | 45.7 /100 | #180 | Average 31.8% |
| Immigrants | Peru | 45.1 /100 | #181 | Average 31.8% |
| Kenyans | 43.0 /100 | #182 | Average 31.9% |
| Canadians | 41.4 /100 | #183 | Average 31.9% |
| Immigrants | South America | 40.7 /100 | #184 | Average 32.0% |