Hawaiian vs Immigrants from China Family Households

COMPARE

Hawaiian
Race
Ancestry
AfghanAfricanAlaska NativeAlaskan AthabascanAlbanianAleutAlsatianAmericanApacheArabArapahoArgentineanArmenianAssyrian/Chaldean/SyriacAustralianAustrianBahamianBangladeshiBarbadianBasqueBelgianBelizeanBermudanBhutaneseBlackfeetBolivianBrazilianBritishBritish West IndianBulgarianBurmeseCajunCambodianCanadianCape VerdeanCarpatho RusynCelticCentral AmericanCentral American IndianCherokeeCheyenneChickasawChileanChineseChippewaChoctawColombianColvilleComancheCosta RicanCreeCreekCroatianCrowCubanCypriotCzechCzechoslovakianDanishDelawareDominicanDutchDutch West IndianEastern EuropeanEcuadorianEgyptianEnglishEstonianEthiopianEuropeanFijianFilipinoFinnishFrenchFrench American IndianFrench CanadianGermanGerman RussianGhanaianGreekGuamanian/ChamorroGuatemalanGuyaneseHaitianHmongHonduranHopiHoumaHungarianIcelanderIndian (Asian)IndonesianInupiatIranianIraqiIrishIroquoisIsraeliItalianJamaicanJapaneseJordanianKenyanKiowaKoreanLaotianLatvianLebaneseLiberianLithuanianLumbeeLuxembourgerMacedonianMalaysianMalteseMarshalleseMenomineeMexicanMexican American IndianMongolianMoroccanNative HawaiianNavajoNepaleseNew ZealanderNicaraguanNigerianNorthern EuropeanNorwegianOkinawanOsageOttawaPaiutePakistaniPalestinianPanamanianParaguayanPennsylvania GermanPeruvianPimaPolishPortuguesePotawatomiPuebloPuerto RicanPuget Sound SalishRomanianRussianSalvadoranSamoanScandinavianScotch-IrishScottishSeminoleSenegaleseSerbianShoshoneSierra LeoneanSiouxSlavicSlovakSloveneSomaliSouth AfricanSouth AmericanSouth American IndianSoviet UnionSpaniardSpanishSpanish AmericanSpanish American IndianSri LankanSubsaharan AfricanSudaneseSwedishSwissSyrianTaiwaneseThaiTlingit-HaidaTohono O'OdhamTonganTrinidadian and TobagonianTsimshianTurkishU.S. Virgin IslanderUgandanUkrainianUruguayanUteVenezuelanVietnameseWelshWest IndianYakamaYaquiYugoslavianYumanYup'ikZimbabwean
Immigration
NonimmigrantsImmigrantsAfghanistanAfricaAlbaniaArgentinaArmeniaAsiaAustraliaAustriaBahamasBangladeshBarbadosBelarusBelgiumBelizeBoliviaBosnia and HerzegovinaBrazilBulgariaBurma/MyanmarCabo VerdeCambodiaCameroonCanadaCaribbeanCentral AmericaChileColombiaCongoCosta RicaCroatiaCubaCzechoslovakiaDenmarkDominicaDominican RepublicEastern AfricaEastern AsiaEastern EuropeEcuadorEgyptEl SalvadorEnglandEritreaEthiopiaEuropeFijiFranceGermanyGhanaGreeceGrenadaGuatemalaGuyanaHaitiHondurasHong KongHungaryIndiaIndonesiaIranIraqIrelandIsraelItalyJamaicaJapanJordanKazakhstanKenyaKoreaKuwaitLaosLatin AmericaLatviaLebanonLiberiaLithuaniaMalaysiaMexicoMicronesiaMiddle AfricaMoldovaMoroccoNepalNetherlandsNicaraguaNigeriaNorth AmericaNorth MacedoniaNorthern AfricaNorthern EuropeNorwayOceaniaPakistanPanamaPeruPhilippinesPolandPortugalRomaniaRussiaSaudi ArabiaScotlandSenegalSerbiaSierra LeoneSingaporeSomaliaSouth AfricaSouth AmericaSouth Central AsiaSouth Eastern AsiaSouthern EuropeSpainSri LankaSt. Vincent and the GrenadinesSudanSwedenSwitzerlandSyriaTaiwanThailandTrinidad and TobagoTurkeyUgandaUkraineUruguayUzbekistanVenezuelaVietnamWest IndiesWestern AfricaWestern AsiaWestern EuropeYemenZaireZimbabweAzores
Immigrants from China
Race
Ancestry
AfghanAfricanAlaska NativeAlaskan AthabascanAlbanianAleutAlsatianAmericanApacheArabArapahoArgentineanArmenianAssyrian/Chaldean/SyriacAustralianAustrianBahamianBangladeshiBarbadianBasqueBelgianBelizeanBermudanBhutaneseBlackfeetBolivianBrazilianBritishBritish West IndianBulgarianBurmeseCajunCambodianCanadianCape VerdeanCarpatho RusynCelticCentral AmericanCentral American IndianCherokeeCheyenneChickasawChileanChineseChippewaChoctawColombianColvilleComancheCosta RicanCreeCreekCroatianCrowCubanCypriotCzechCzechoslovakianDanishDelawareDominicanDutchDutch West IndianEastern EuropeanEcuadorianEgyptianEnglishEstonianEthiopianEuropeanFijianFilipinoFinnishFrenchFrench American IndianFrench CanadianGermanGerman RussianGhanaianGreekGuamanian/ChamorroGuatemalanGuyaneseHaitianHmongHonduranHopiHoumaHungarianIcelanderIndian (Asian)IndonesianInupiatIranianIraqiIrishIroquoisIsraeliItalianJamaicanJapaneseJordanianKenyanKiowaKoreanLaotianLatvianLebaneseLiberianLithuanianLumbeeLuxembourgerMacedonianMalaysianMalteseMarshalleseMenomineeMexicanMexican American IndianMongolianMoroccanNative HawaiianNavajoNepaleseNew ZealanderNicaraguanNigerianNorthern EuropeanNorwegianOkinawanOsageOttawaPaiutePakistaniPalestinianPanamanianParaguayanPennsylvania GermanPeruvianPimaPolishPortuguesePotawatomiPuebloPuerto RicanPuget Sound SalishRomanianRussianSalvadoranSamoanScandinavianScotch-IrishScottishSeminoleSenegaleseSerbianShoshoneSierra LeoneanSiouxSlavicSlovakSloveneSomaliSouth AfricanSouth AmericanSouth American IndianSoviet UnionSpaniardSpanishSpanish AmericanSpanish American IndianSri LankanSubsaharan AfricanSudaneseSwedishSwissSyrianTaiwaneseThaiTlingit-HaidaTohono O'OdhamTonganTrinidadian and TobagonianTsimshianTurkishU.S. Virgin IslanderUgandanUkrainianUruguayanUteVenezuelanVietnameseWelshWest IndianYakamaYaquiYugoslavianYumanYup'ikZimbabwean
Immigration
NonimmigrantsImmigrantsAfghanistanAfricaAlbaniaArgentinaArmeniaAsiaAustraliaAustriaBahamasBangladeshBarbadosBelarusBelgiumBelizeBoliviaBosnia and HerzegovinaBrazilBulgariaBurma/MyanmarCabo VerdeCambodiaCameroonCanadaCaribbeanCentral AmericaChileChinaColombiaCongoCosta RicaCroatiaCubaCzechoslovakiaDenmarkDominicaDominican RepublicEastern AfricaEastern AsiaEastern EuropeEcuadorEgyptEl SalvadorEnglandEritreaEthiopiaEuropeFijiFranceGermanyGhanaGreeceGrenadaGuatemalaGuyanaHaitiHondurasHong KongHungaryIndiaIndonesiaIranIraqIrelandIsraelItalyJamaicaJapanJordanKazakhstanKenyaKoreaKuwaitLaosLatin AmericaLatviaLebanonLiberiaLithuaniaMalaysiaMexicoMicronesiaMiddle AfricaMoldovaMoroccoNepalNetherlandsNicaraguaNigeriaNorth AmericaNorth MacedoniaNorthern AfricaNorthern EuropeNorwayOceaniaPakistanPanamaPeruPhilippinesPolandPortugalRomaniaRussiaSaudi ArabiaScotlandSenegalSerbiaSierra LeoneSingaporeSomaliaSouth AfricaSouth AmericaSouth Central AsiaSouth Eastern AsiaSouthern EuropeSpainSri LankaSt. Vincent and the GrenadinesSudanSwedenSwitzerlandSyriaTaiwanThailandTrinidad and TobagoTurkeyUgandaUkraineUruguayUzbekistanVenezuelaVietnamWest IndiesWestern AfricaWestern AsiaWestern EuropeYemenZaireZimbabweAzores
Family Households
Income
Poverty
Unemployment
Labor Participation
Family Structure
Vehicle Availability
Education Level
Disability

Family Households Comparison

Hawaiians

Immigrants from China

Exceptional
Excellent
67.4%
FAMILY HOUSEHOLDS
100.0/ 100
METRIC RATING
28th/ 347
METRIC RANK
64.7%
FAMILY HOUSEHOLDS
86.6/ 100
METRIC RATING
136th/ 347
METRIC RANK

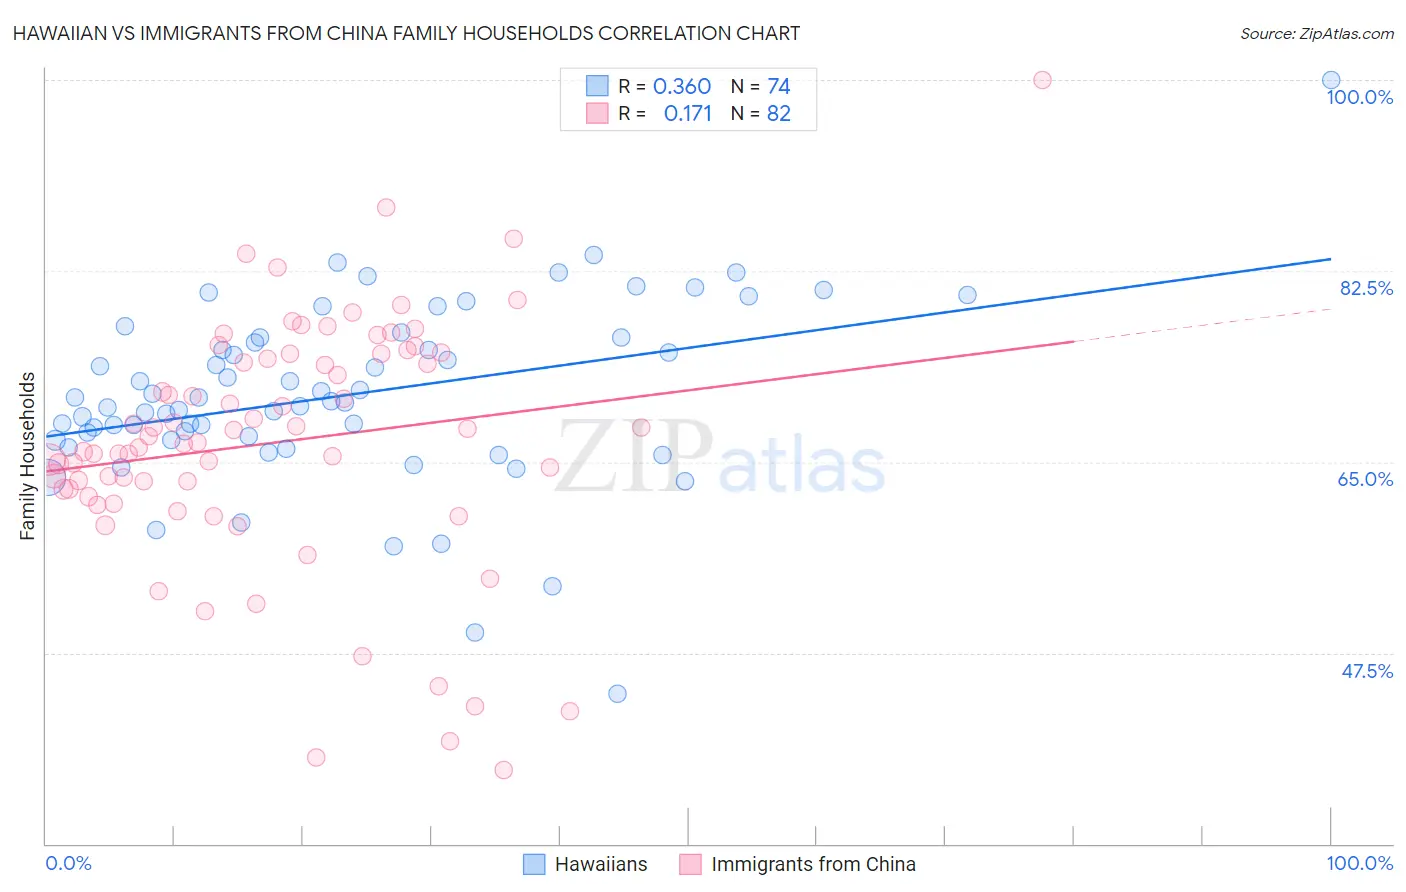
Hawaiian vs Immigrants from China Family Households Correlation Chart

The statistical analysis conducted on geographies consisting of 327,392,617 people shows a mild positive correlation between the proportion of Hawaiians and percentage of family households in the United States with a correlation coefficient (R) of 0.360 and weighted average of 67.4%. Similarly, the statistical analysis conducted on geographies consisting of 456,596,066 people shows a poor positive correlation between the proportion of Immigrants from China and percentage of family households in the United States with a correlation coefficient (R) of 0.171 and weighted average of 64.7%, a difference of 4.2%.
Hawaiian vs Immigrants from China Family Households

Family Households Correlation Summary

MeasurementHawaiianImmigrants from China
Minimum43.7%36.8%
Maximum100.0%100.0%
Range56.3%63.2%
Mean71.1%66.8%
Median70.5%67.1%
Interquartile 25% (IQ1)67.0%62.5%
Interquartile 75% (IQ3)76.4%74.9%
Interquartile Range (IQR)9.3%12.4%
Standard Deviation (Sample)8.5%11.3%
Standard Deviation (Population)8.4%11.3%

Similar Demographics by Family Households

Demographics Similar to Hawaiians by Family Households

In terms of family households, the demographic groups most similar to Hawaiians are Hispanic or Latino (67.4%, a difference of 0.010%), Immigrants from India (67.4%, a difference of 0.060%), Immigrants from Nicaragua (67.5%, a difference of 0.070%), Nicaraguan (67.4%, a difference of 0.070%), and Immigrants from South Eastern Asia (67.5%, a difference of 0.090%).
DemographicsRating | RankFamily Households
Cubans
100.0
/100
|
#21
Exceptional
67.7%
Sri Lankans
100.0
/100
|
#22
Exceptional
67.7%
Immigrants | Pakistan
100.0
/100
|
#23
Exceptional
67.7%
Immigrants | South Eastern Asia
100.0
/100
|
#24
Exceptional
67.5%
Immigrants | Nicaragua
100.0
/100
|
#25
Exceptional
67.5%
Immigrants | India
100.0
/100
|
#26
Exceptional
67.4%
Hispanics or Latinos
100.0
/100
|
#27
Exceptional
67.4%
Hawaiians
100.0
/100
|
#28
Exceptional
67.4%
Nicaraguans
100.0
/100
|
#29
Exceptional
67.4%
Immigrants | Peru
100.0
/100
|
#30
Exceptional
67.2%
Immigrants | Latin America
100.0
/100
|
#31
Exceptional
67.2%
Nepalese
100.0
/100
|
#32
Exceptional
67.2%
Salvadorans
100.0
/100
|
#33
Exceptional
67.2%
Thais
100.0
/100
|
#34
Exceptional
67.2%
Tohono O'odham
100.0
/100
|
#35
Exceptional
67.1%

Demographics Similar to Immigrants from China by Family Households

In terms of family households, the demographic groups most similar to Immigrants from China are Immigrants from Scotland (64.7%, a difference of 0.010%), Maltese (64.7%, a difference of 0.030%), Basque (64.7%, a difference of 0.030%), Immigrants from Jamaica (64.7%, a difference of 0.030%), and Immigrants from North Macedonia (64.7%, a difference of 0.040%).
DemographicsRating | RankFamily Households
Immigrants | Ecuador
91.4
/100
|
#129
Exceptional
64.8%
Immigrants | Italy
90.2
/100
|
#130
Exceptional
64.8%
Immigrants | Nonimmigrants
90.1
/100
|
#131
Exceptional
64.8%
Cajuns
89.4
/100
|
#132
Excellent
64.8%
Belizeans
89.3
/100
|
#133
Excellent
64.8%
Greeks
88.1
/100
|
#134
Excellent
64.7%
Maltese
87.4
/100
|
#135
Excellent
64.7%
Immigrants | China
86.6
/100
|
#136
Excellent
64.7%
Immigrants | Scotland
86.4
/100
|
#137
Excellent
64.7%
Basques
85.5
/100
|
#138
Excellent
64.7%
Immigrants | Jamaica
85.3
/100
|
#139
Excellent
64.7%
Immigrants | North Macedonia
84.9
/100
|
#140
Excellent
64.7%
Immigrants | Cameroon
84.8
/100
|
#141
Excellent
64.7%
Pakistanis
84.0
/100
|
#142
Excellent
64.7%
Czechoslovakians
82.1
/100
|
#143
Excellent
64.6%