Hawaiian vs Immigrants from Greece Family Households

COMPARE

Hawaiian
Race
Ancestry
AfghanAfricanAlaska NativeAlaskan AthabascanAlbanianAleutAlsatianAmericanApacheArabArapahoArgentineanArmenianAssyrian/Chaldean/SyriacAustralianAustrianBahamianBangladeshiBarbadianBasqueBelgianBelizeanBermudanBhutaneseBlackfeetBolivianBrazilianBritishBritish West IndianBulgarianBurmeseCajunCambodianCanadianCape VerdeanCarpatho RusynCelticCentral AmericanCentral American IndianCherokeeCheyenneChickasawChileanChineseChippewaChoctawColombianColvilleComancheCosta RicanCreeCreekCroatianCrowCubanCypriotCzechCzechoslovakianDanishDelawareDominicanDutchDutch West IndianEastern EuropeanEcuadorianEgyptianEnglishEstonianEthiopianEuropeanFijianFilipinoFinnishFrenchFrench American IndianFrench CanadianGermanGerman RussianGhanaianGreekGuamanian/ChamorroGuatemalanGuyaneseHaitianHmongHonduranHopiHoumaHungarianIcelanderIndian (Asian)IndonesianInupiatIranianIraqiIrishIroquoisIsraeliItalianJamaicanJapaneseJordanianKenyanKiowaKoreanLaotianLatvianLebaneseLiberianLithuanianLumbeeLuxembourgerMacedonianMalaysianMalteseMarshalleseMenomineeMexicanMexican American IndianMongolianMoroccanNative HawaiianNavajoNepaleseNew ZealanderNicaraguanNigerianNorthern EuropeanNorwegianOkinawanOsageOttawaPaiutePakistaniPalestinianPanamanianParaguayanPennsylvania GermanPeruvianPimaPolishPortuguesePotawatomiPuebloPuerto RicanPuget Sound SalishRomanianRussianSalvadoranSamoanScandinavianScotch-IrishScottishSeminoleSenegaleseSerbianShoshoneSierra LeoneanSiouxSlavicSlovakSloveneSomaliSouth AfricanSouth AmericanSouth American IndianSoviet UnionSpaniardSpanishSpanish AmericanSpanish American IndianSri LankanSubsaharan AfricanSudaneseSwedishSwissSyrianTaiwaneseThaiTlingit-HaidaTohono O'OdhamTonganTrinidadian and TobagonianTsimshianTurkishU.S. Virgin IslanderUgandanUkrainianUruguayanUteVenezuelanVietnameseWelshWest IndianYakamaYaquiYugoslavianYumanYup'ikZimbabwean
Immigration
NonimmigrantsImmigrantsAfghanistanAfricaAlbaniaArgentinaArmeniaAsiaAustraliaAustriaBahamasBangladeshBarbadosBelarusBelgiumBelizeBoliviaBosnia and HerzegovinaBrazilBulgariaBurma/MyanmarCabo VerdeCambodiaCameroonCanadaCaribbeanCentral AmericaChileChinaColombiaCongoCosta RicaCroatiaCubaCzechoslovakiaDenmarkDominicaDominican RepublicEastern AfricaEastern AsiaEastern EuropeEcuadorEgyptEl SalvadorEnglandEritreaEthiopiaEuropeFijiFranceGermanyGhanaGrenadaGuatemalaGuyanaHaitiHondurasHong KongHungaryIndiaIndonesiaIranIraqIrelandIsraelItalyJamaicaJapanJordanKazakhstanKenyaKoreaKuwaitLaosLatin AmericaLatviaLebanonLiberiaLithuaniaMalaysiaMexicoMicronesiaMiddle AfricaMoldovaMoroccoNepalNetherlandsNicaraguaNigeriaNorth AmericaNorth MacedoniaNorthern AfricaNorthern EuropeNorwayOceaniaPakistanPanamaPeruPhilippinesPolandPortugalRomaniaRussiaSaudi ArabiaScotlandSenegalSerbiaSierra LeoneSingaporeSomaliaSouth AfricaSouth AmericaSouth Central AsiaSouth Eastern AsiaSouthern EuropeSpainSri LankaSt. Vincent and the GrenadinesSudanSwedenSwitzerlandSyriaTaiwanThailandTrinidad and TobagoTurkeyUgandaUkraineUruguayUzbekistanVenezuelaVietnamWest IndiesWestern AfricaWestern AsiaWestern EuropeYemenZaireZimbabweAzores
Immigrants from Greece
Race
Ancestry
AfghanAfricanAlaska NativeAlaskan AthabascanAlbanianAleutAlsatianAmericanApacheArabArapahoArgentineanArmenianAssyrian/Chaldean/SyriacAustralianAustrianBahamianBangladeshiBarbadianBasqueBelgianBelizeanBermudanBhutaneseBlackfeetBolivianBrazilianBritishBritish West IndianBulgarianBurmeseCajunCambodianCanadianCape VerdeanCarpatho RusynCelticCentral AmericanCentral American IndianCherokeeCheyenneChickasawChileanChineseChippewaChoctawColombianColvilleComancheCosta RicanCreeCreekCroatianCrowCubanCypriotCzechCzechoslovakianDanishDelawareDominicanDutchDutch West IndianEastern EuropeanEcuadorianEgyptianEnglishEstonianEthiopianEuropeanFijianFilipinoFinnishFrenchFrench American IndianFrench CanadianGermanGerman RussianGhanaianGreekGuamanian/ChamorroGuatemalanGuyaneseHaitianHmongHonduranHopiHoumaHungarianIcelanderIndian (Asian)IndonesianInupiatIranianIraqiIrishIroquoisIsraeliItalianJamaicanJapaneseJordanianKenyanKiowaKoreanLaotianLatvianLebaneseLiberianLithuanianLumbeeLuxembourgerMacedonianMalaysianMalteseMarshalleseMenomineeMexicanMexican American IndianMongolianMoroccanNative HawaiianNavajoNepaleseNew ZealanderNicaraguanNigerianNorthern EuropeanNorwegianOkinawanOsageOttawaPaiutePakistaniPalestinianPanamanianParaguayanPennsylvania GermanPeruvianPimaPolishPortuguesePotawatomiPuebloPuerto RicanPuget Sound SalishRomanianRussianSalvadoranSamoanScandinavianScotch-IrishScottishSeminoleSenegaleseSerbianShoshoneSierra LeoneanSiouxSlavicSlovakSloveneSomaliSouth AfricanSouth AmericanSouth American IndianSoviet UnionSpaniardSpanishSpanish AmericanSpanish American IndianSri LankanSubsaharan AfricanSudaneseSwedishSwissSyrianTaiwaneseThaiTlingit-HaidaTohono O'OdhamTonganTrinidadian and TobagonianTsimshianTurkishU.S. Virgin IslanderUgandanUkrainianUruguayanUteVenezuelanVietnameseWelshWest IndianYakamaYaquiYugoslavianYumanYup'ikZimbabwean
Immigration
NonimmigrantsImmigrantsAfghanistanAfricaAlbaniaArgentinaArmeniaAsiaAustraliaAustriaBahamasBangladeshBarbadosBelarusBelgiumBelizeBoliviaBosnia and HerzegovinaBrazilBulgariaBurma/MyanmarCabo VerdeCambodiaCameroonCanadaCaribbeanCentral AmericaChileChinaColombiaCongoCosta RicaCroatiaCubaCzechoslovakiaDenmarkDominicaDominican RepublicEastern AfricaEastern AsiaEastern EuropeEcuadorEgyptEl SalvadorEnglandEritreaEthiopiaEuropeFijiFranceGermanyGhanaGreeceGrenadaGuatemalaGuyanaHaitiHondurasHong KongHungaryIndiaIndonesiaIranIraqIrelandIsraelItalyJamaicaJapanJordanKazakhstanKenyaKoreaKuwaitLaosLatin AmericaLatviaLebanonLiberiaLithuaniaMalaysiaMexicoMicronesiaMiddle AfricaMoldovaMoroccoNepalNetherlandsNicaraguaNigeriaNorth AmericaNorth MacedoniaNorthern AfricaNorthern EuropeNorwayOceaniaPakistanPanamaPeruPhilippinesPolandPortugalRomaniaRussiaSaudi ArabiaScotlandSenegalSerbiaSierra LeoneSingaporeSomaliaSouth AfricaSouth AmericaSouth Central AsiaSouth Eastern AsiaSouthern EuropeSpainSri LankaSt. Vincent and the GrenadinesSudanSwedenSwitzerlandSyriaTaiwanThailandTrinidad and TobagoTurkeyUgandaUkraineUruguayUzbekistanVenezuelaVietnamWest IndiesWestern AfricaWestern AsiaWestern EuropeYemenZaireZimbabweAzores
Family Households
Income
Poverty
Unemployment
Labor Participation
Family Structure
Vehicle Availability
Education Level
Disability

Family Households Comparison

Hawaiians

Immigrants from Greece

Exceptional
Tragic
67.4%
FAMILY HOUSEHOLDS
100.0/ 100
METRIC RATING
28th/ 347
METRIC RANK
63.5%
FAMILY HOUSEHOLDS
2.9/ 100
METRIC RATING
231st/ 347
METRIC RANK

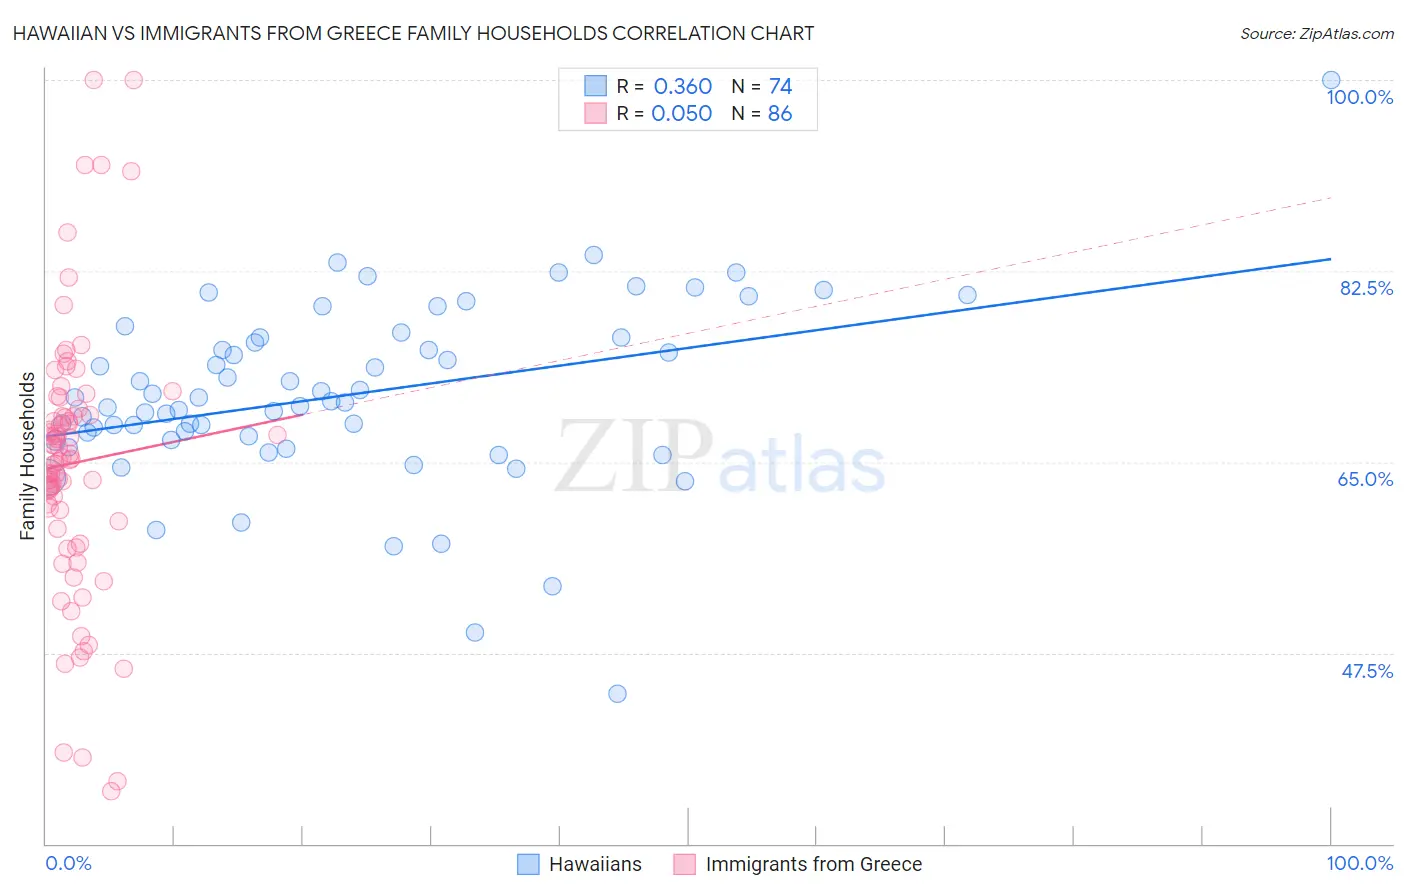
Hawaiian vs Immigrants from Greece Family Households Correlation Chart

The statistical analysis conducted on geographies consisting of 327,392,617 people shows a mild positive correlation between the proportion of Hawaiians and percentage of family households in the United States with a correlation coefficient (R) of 0.360 and weighted average of 67.4%. Similarly, the statistical analysis conducted on geographies consisting of 216,856,850 people shows no correlation between the proportion of Immigrants from Greece and percentage of family households in the United States with a correlation coefficient (R) of 0.050 and weighted average of 63.5%, a difference of 6.1%.
Hawaiian vs Immigrants from Greece Family Households

Family Households Correlation Summary

MeasurementHawaiianImmigrants from Greece
Minimum43.7%34.8%
Maximum100.0%100.0%
Range56.3%65.2%
Mean71.1%64.9%
Median70.5%65.2%
Interquartile 25% (IQ1)67.0%59.6%
Interquartile 75% (IQ3)76.4%69.3%
Interquartile Range (IQR)9.3%9.7%
Standard Deviation (Sample)8.5%12.3%
Standard Deviation (Population)8.4%12.3%

Similar Demographics by Family Households

Demographics Similar to Hawaiians by Family Households

In terms of family households, the demographic groups most similar to Hawaiians are Hispanic or Latino (67.4%, a difference of 0.010%), Immigrants from India (67.4%, a difference of 0.060%), Immigrants from Nicaragua (67.5%, a difference of 0.070%), Nicaraguan (67.4%, a difference of 0.070%), and Immigrants from South Eastern Asia (67.5%, a difference of 0.090%).
DemographicsRating | RankFamily Households
Cubans
100.0
/100
|
#21
Exceptional
67.7%
Sri Lankans
100.0
/100
|
#22
Exceptional
67.7%
Immigrants | Pakistan
100.0
/100
|
#23
Exceptional
67.7%
Immigrants | South Eastern Asia
100.0
/100
|
#24
Exceptional
67.5%
Immigrants | Nicaragua
100.0
/100
|
#25
Exceptional
67.5%
Immigrants | India
100.0
/100
|
#26
Exceptional
67.4%
Hispanics or Latinos
100.0
/100
|
#27
Exceptional
67.4%
Hawaiians
100.0
/100
|
#28
Exceptional
67.4%
Nicaraguans
100.0
/100
|
#29
Exceptional
67.4%
Immigrants | Peru
100.0
/100
|
#30
Exceptional
67.2%
Immigrants | Latin America
100.0
/100
|
#31
Exceptional
67.2%
Nepalese
100.0
/100
|
#32
Exceptional
67.2%
Salvadorans
100.0
/100
|
#33
Exceptional
67.2%
Thais
100.0
/100
|
#34
Exceptional
67.2%
Tohono O'odham
100.0
/100
|
#35
Exceptional
67.1%

Demographics Similar to Immigrants from Greece by Family Households

In terms of family households, the demographic groups most similar to Immigrants from Greece are Immigrants from Brazil (63.6%, a difference of 0.020%), Immigrants from Northern Africa (63.5%, a difference of 0.030%), Immigrants from Armenia (63.5%, a difference of 0.050%), Bulgarian (63.6%, a difference of 0.060%), and Blackfeet (63.6%, a difference of 0.070%).
DemographicsRating | RankFamily Households
Turks
4.5
/100
|
#224
Tragic
63.6%
Immigrants | Hungary
4.3
/100
|
#225
Tragic
63.6%
Immigrants | Bahamas
4.2
/100
|
#226
Tragic
63.6%
Trinidadians and Tobagonians
4.1
/100
|
#227
Tragic
63.6%
Blackfeet
3.6
/100
|
#228
Tragic
63.6%
Bulgarians
3.4
/100
|
#229
Tragic
63.6%
Immigrants | Brazil
3.0
/100
|
#230
Tragic
63.6%
Immigrants | Greece
2.9
/100
|
#231
Tragic
63.5%
Immigrants | Northern Africa
2.6
/100
|
#232
Tragic
63.5%
Immigrants | Armenia
2.6
/100
|
#233
Tragic
63.5%
Finns
2.3
/100
|
#234
Tragic
63.5%
Albanians
2.2
/100
|
#235
Tragic
63.5%
Ghanaians
2.1
/100
|
#236
Tragic
63.5%
Comanche
2.1
/100
|
#237
Tragic
63.5%
Immigrants | Zimbabwe
2.0
/100
|
#238
Tragic
63.5%