Cajun vs Subsaharan African Single Mother Households
COMPARE
Cajun
Subsaharan African
Single Mother Households
Single Mother Households Comparison
Cajuns
Sub-Saharan Africans
7.3%
SINGLE MOTHER HOUSEHOLDS
0.3/ 100
METRIC RATING
253rd/ 347
METRIC RANK
7.8%
SINGLE MOTHER HOUSEHOLDS
0.0/ 100
METRIC RATING
289th/ 347
METRIC RANK
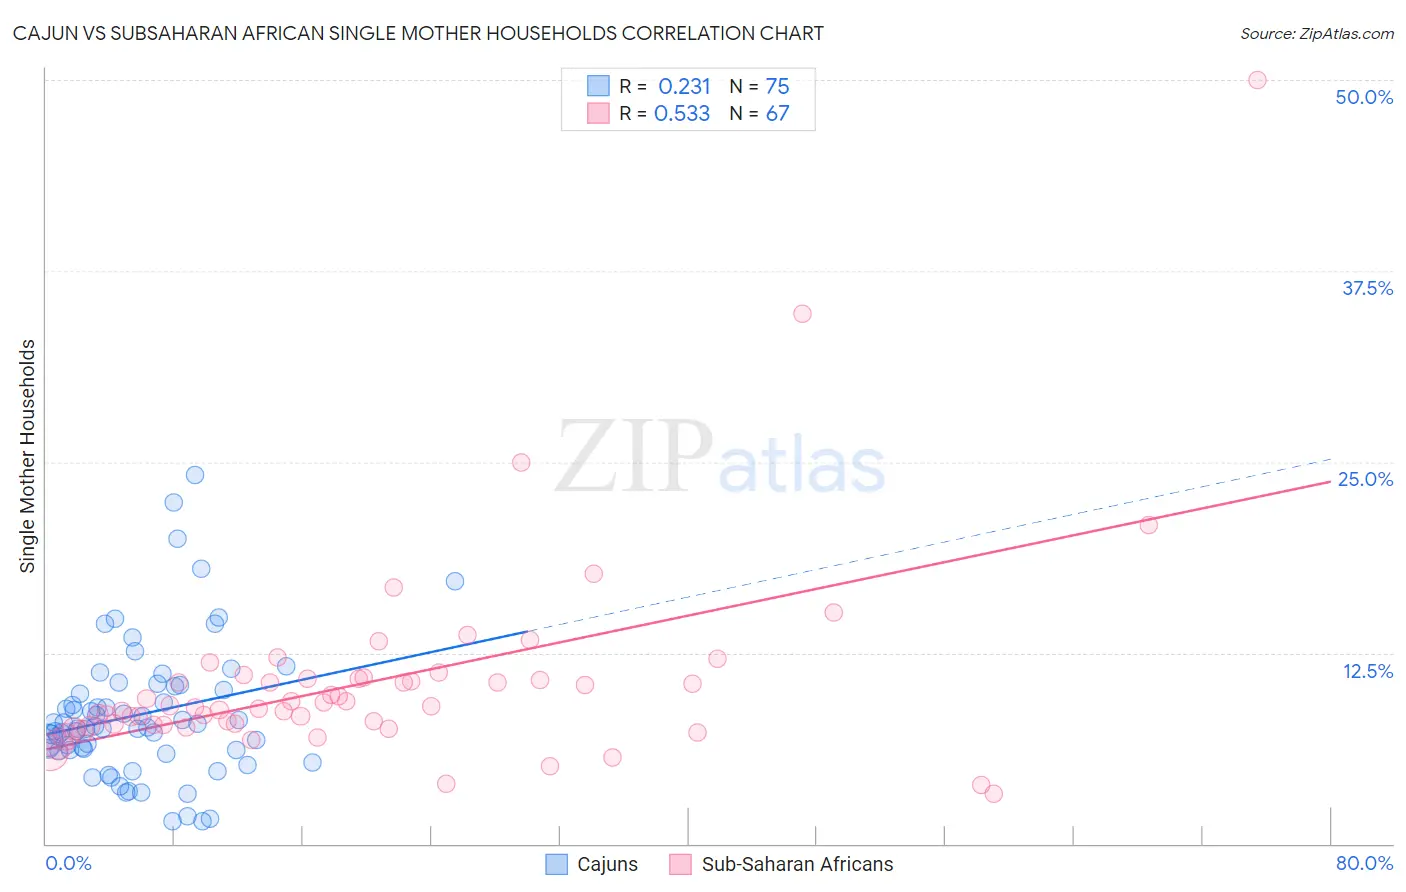
Cajun vs Subsaharan African Single Mother Households Correlation Chart
The statistical analysis conducted on geographies consisting of 149,572,157 people shows a weak positive correlation between the proportion of Cajuns and percentage of single mother households in the United States with a correlation coefficient (R) of 0.231 and weighted average of 7.3%. Similarly, the statistical analysis conducted on geographies consisting of 505,994,563 people shows a substantial positive correlation between the proportion of Sub-Saharan Africans and percentage of single mother households in the United States with a correlation coefficient (R) of 0.533 and weighted average of 7.8%, a difference of 6.4%.
Single Mother Households Correlation Summary
| Measurement | Cajun | Subsaharan African |
| Minimum | 1.5% | 3.2% |
| Maximum | 24.1% | 50.0% |
| Range | 22.6% | 46.8% |
| Mean | 8.5% | 10.6% |
| Median | 7.6% | 9.0% |
| Interquartile 25% (IQ1) | 6.2% | 7.8% |
| Interquartile 75% (IQ3) | 10.3% | 10.8% |
| Interquartile Range (IQR) | 4.1% | 3.0% |
| Standard Deviation (Sample) | 4.4% | 6.8% |
| Standard Deviation (Population) | 4.4% | 6.7% |
Similar Demographics by Single Mother Households
Demographics Similar to Cajuns by Single Mother Households
In terms of single mother households, the demographic groups most similar to Cajuns are Immigrants from Ecuador (7.3%, a difference of 0.050%), Alaskan Athabascan (7.3%, a difference of 0.38%), Malaysian (7.3%, a difference of 0.41%), Mexican American Indian (7.4%, a difference of 0.42%), and Immigrants from Africa (7.3%, a difference of 0.75%).
| Demographics | Rating | Rank | Single Mother Households |
| Nicaraguans | 0.5 /100 | #246 | Tragic 7.2% |
| Dutch West Indians | 0.4 /100 | #247 | Tragic 7.3% |
| Spanish American Indians | 0.4 /100 | #248 | Tragic 7.3% |
| Bermudans | 0.4 /100 | #249 | Tragic 7.3% |
| Immigrants | Africa | 0.4 /100 | #250 | Tragic 7.3% |
| Malaysians | 0.3 /100 | #251 | Tragic 7.3% |
| Alaskan Athabascans | 0.3 /100 | #252 | Tragic 7.3% |
| Cajuns | 0.3 /100 | #253 | Tragic 7.3% |
| Immigrants | Ecuador | 0.3 /100 | #254 | Tragic 7.3% |
| Mexican American Indians | 0.2 /100 | #255 | Tragic 7.4% |
| Seminole | 0.2 /100 | #256 | Tragic 7.4% |
| Alaska Natives | 0.2 /100 | #257 | Tragic 7.4% |
| Pueblo | 0.2 /100 | #258 | Tragic 7.4% |
| Immigrants | Yemen | 0.2 /100 | #259 | Tragic 7.4% |
| Immigrants | Zaire | 0.2 /100 | #260 | Tragic 7.4% |
Demographics Similar to Sub-Saharan Africans by Single Mother Households
In terms of single mother households, the demographic groups most similar to Sub-Saharan Africans are Immigrants from Nigeria (7.8%, a difference of 0.42%), West Indian (7.8%, a difference of 0.50%), Ghanaian (7.8%, a difference of 0.51%), Immigrants from Cameroon (7.9%, a difference of 0.87%), and Sierra Leonean (7.7%, a difference of 0.92%).
| Demographics | Rating | Rank | Single Mother Households |
| Guatemalans | 0.0 /100 | #282 | Tragic 7.7% |
| Nigerians | 0.0 /100 | #283 | Tragic 7.7% |
| Immigrants | Belize | 0.0 /100 | #284 | Tragic 7.7% |
| Trinidadians and Tobagonians | 0.0 /100 | #285 | Tragic 7.7% |
| Immigrants | Middle Africa | 0.0 /100 | #286 | Tragic 7.7% |
| Immigrants | Guatemala | 0.0 /100 | #287 | Tragic 7.7% |
| Sierra Leoneans | 0.0 /100 | #288 | Tragic 7.7% |
| Sub-Saharan Africans | 0.0 /100 | #289 | Tragic 7.8% |
| Immigrants | Nigeria | 0.0 /100 | #290 | Tragic 7.8% |
| West Indians | 0.0 /100 | #291 | Tragic 7.8% |
| Ghanaians | 0.0 /100 | #292 | Tragic 7.8% |
| Immigrants | Cameroon | 0.0 /100 | #293 | Tragic 7.9% |
| Apache | 0.0 /100 | #294 | Tragic 7.9% |
| Barbadians | 0.0 /100 | #295 | Tragic 7.9% |
| Immigrants | Latin America | 0.0 /100 | #296 | Tragic 7.9% |