Brazilian vs Subsaharan African Single Mother Households
COMPARE
Brazilian
Subsaharan African
Single Mother Households
Single Mother Households Comparison
Brazilians
Sub-Saharan Africans
6.2%
SINGLE MOTHER HOUSEHOLDS
59.1/ 100
METRIC RATING
167th/ 347
METRIC RANK
7.8%
SINGLE MOTHER HOUSEHOLDS
0.0/ 100
METRIC RATING
289th/ 347
METRIC RANK
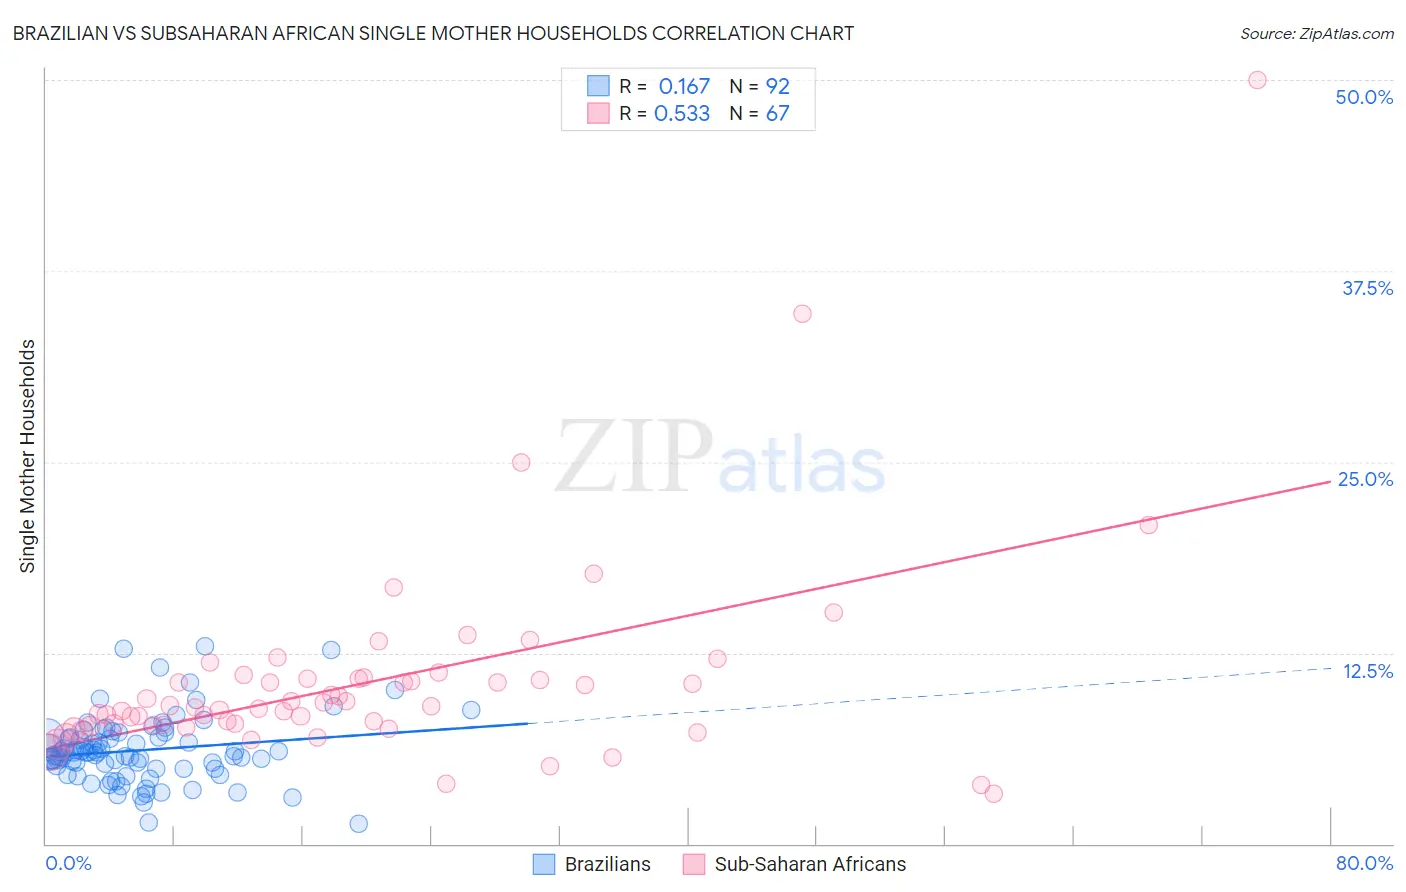
Brazilian vs Subsaharan African Single Mother Households Correlation Chart
The statistical analysis conducted on geographies consisting of 323,280,252 people shows a poor positive correlation between the proportion of Brazilians and percentage of single mother households in the United States with a correlation coefficient (R) of 0.167 and weighted average of 6.2%. Similarly, the statistical analysis conducted on geographies consisting of 505,994,563 people shows a substantial positive correlation between the proportion of Sub-Saharan Africans and percentage of single mother households in the United States with a correlation coefficient (R) of 0.533 and weighted average of 7.8%, a difference of 24.9%.
Single Mother Households Correlation Summary
| Measurement | Brazilian | Subsaharan African |
| Minimum | 1.3% | 3.2% |
| Maximum | 12.9% | 50.0% |
| Range | 11.6% | 46.8% |
| Mean | 6.1% | 10.6% |
| Median | 6.0% | 9.0% |
| Interquartile 25% (IQ1) | 4.9% | 7.8% |
| Interquartile 75% (IQ3) | 7.0% | 10.8% |
| Interquartile Range (IQR) | 2.1% | 3.0% |
| Standard Deviation (Sample) | 2.2% | 6.8% |
| Standard Deviation (Population) | 2.2% | 6.7% |
Similar Demographics by Single Mother Households
Demographics Similar to Brazilians by Single Mother Households
In terms of single mother households, the demographic groups most similar to Brazilians are Immigrants from Chile (6.3%, a difference of 0.090%), Puget Sound Salish (6.3%, a difference of 0.11%), Immigrants from Oceania (6.3%, a difference of 0.51%), Sri Lankan (6.2%, a difference of 0.57%), and Afghan (6.3%, a difference of 0.74%).
| Demographics | Rating | Rank | Single Mother Households |
| Iraqis | 73.0 /100 | #160 | Good 6.1% |
| Immigrants | Germany | 72.4 /100 | #161 | Good 6.1% |
| Immigrants | Zimbabwe | 69.9 /100 | #162 | Good 6.2% |
| Alsatians | 68.7 /100 | #163 | Good 6.2% |
| Immigrants | Northern Africa | 68.0 /100 | #164 | Good 6.2% |
| Immigrants | Syria | 67.4 /100 | #165 | Good 6.2% |
| Sri Lankans | 63.9 /100 | #166 | Good 6.2% |
| Brazilians | 59.1 /100 | #167 | Average 6.2% |
| Immigrants | Chile | 58.3 /100 | #168 | Average 6.3% |
| Puget Sound Salish | 58.1 /100 | #169 | Average 6.3% |
| Immigrants | Oceania | 54.6 /100 | #170 | Average 6.3% |
| Afghans | 52.5 /100 | #171 | Average 6.3% |
| Immigrants | South Eastern Asia | 52.2 /100 | #172 | Average 6.3% |
| Immigrants | Vietnam | 51.5 /100 | #173 | Average 6.3% |
| Immigrants | Morocco | 50.0 /100 | #174 | Average 6.3% |
Demographics Similar to Sub-Saharan Africans by Single Mother Households
In terms of single mother households, the demographic groups most similar to Sub-Saharan Africans are Immigrants from Nigeria (7.8%, a difference of 0.42%), West Indian (7.8%, a difference of 0.50%), Ghanaian (7.8%, a difference of 0.51%), Immigrants from Cameroon (7.9%, a difference of 0.87%), and Sierra Leonean (7.7%, a difference of 0.92%).
| Demographics | Rating | Rank | Single Mother Households |
| Guatemalans | 0.0 /100 | #282 | Tragic 7.7% |
| Nigerians | 0.0 /100 | #283 | Tragic 7.7% |
| Immigrants | Belize | 0.0 /100 | #284 | Tragic 7.7% |
| Trinidadians and Tobagonians | 0.0 /100 | #285 | Tragic 7.7% |
| Immigrants | Middle Africa | 0.0 /100 | #286 | Tragic 7.7% |
| Immigrants | Guatemala | 0.0 /100 | #287 | Tragic 7.7% |
| Sierra Leoneans | 0.0 /100 | #288 | Tragic 7.7% |
| Sub-Saharan Africans | 0.0 /100 | #289 | Tragic 7.8% |
| Immigrants | Nigeria | 0.0 /100 | #290 | Tragic 7.8% |
| West Indians | 0.0 /100 | #291 | Tragic 7.8% |
| Ghanaians | 0.0 /100 | #292 | Tragic 7.8% |
| Immigrants | Cameroon | 0.0 /100 | #293 | Tragic 7.9% |
| Apache | 0.0 /100 | #294 | Tragic 7.9% |
| Barbadians | 0.0 /100 | #295 | Tragic 7.9% |
| Immigrants | Latin America | 0.0 /100 | #296 | Tragic 7.9% |