Brazilian vs Immigrants from Eritrea Single Mother Households
COMPARE
Brazilian
Immigrants from Eritrea
Single Mother Households
Single Mother Households Comparison
Brazilians
Immigrants from Eritrea
6.2%
SINGLE MOTHER HOUSEHOLDS
59.1/ 100
METRIC RATING
167th/ 347
METRIC RANK
6.7%
SINGLE MOTHER HOUSEHOLDS
8.4/ 100
METRIC RATING
212th/ 347
METRIC RANK
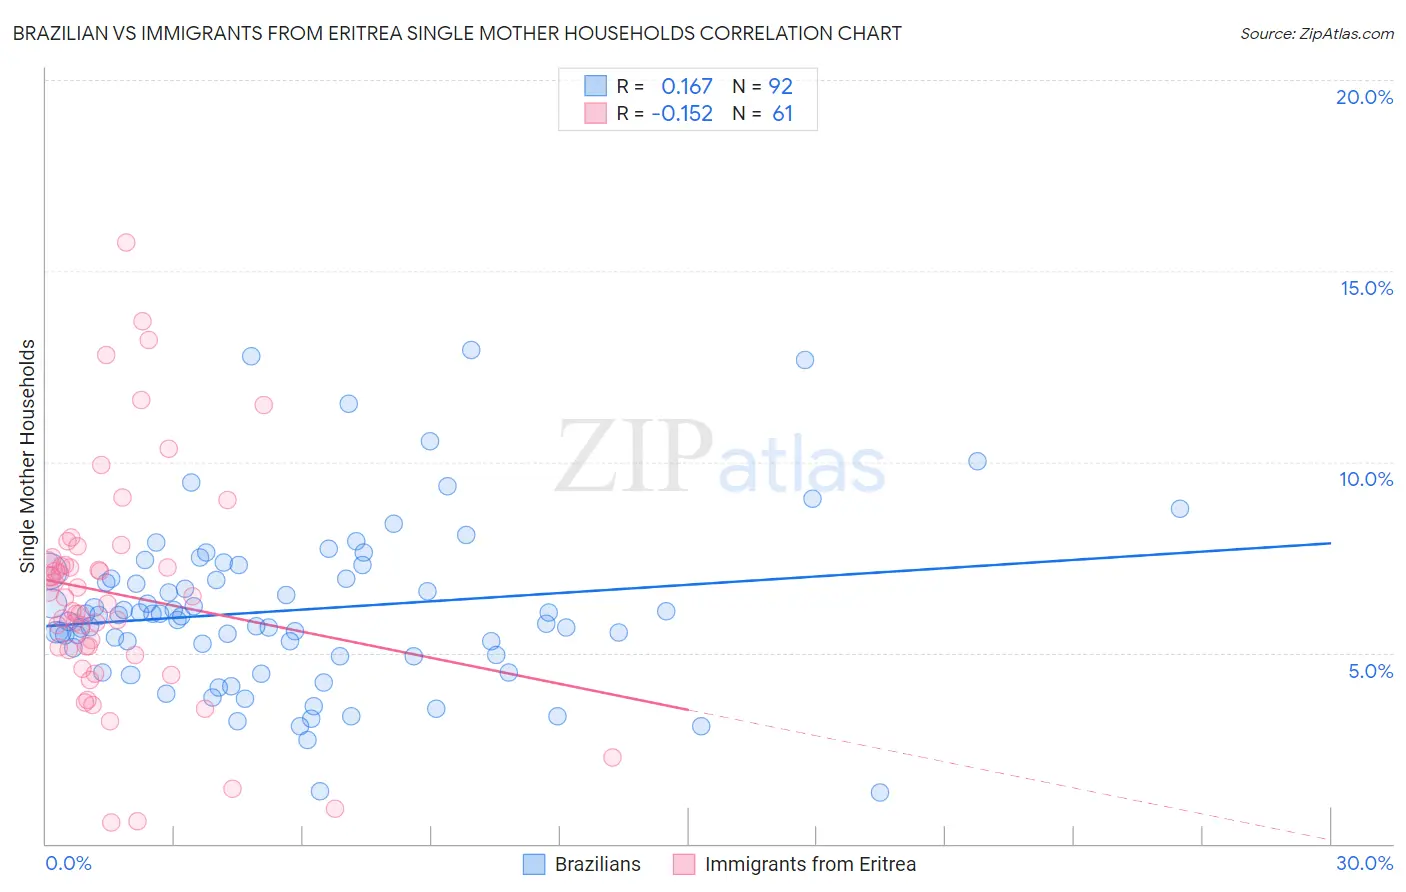
Brazilian vs Immigrants from Eritrea Single Mother Households Correlation Chart
The statistical analysis conducted on geographies consisting of 323,280,252 people shows a poor positive correlation between the proportion of Brazilians and percentage of single mother households in the United States with a correlation coefficient (R) of 0.167 and weighted average of 6.2%. Similarly, the statistical analysis conducted on geographies consisting of 104,781,978 people shows a poor negative correlation between the proportion of Immigrants from Eritrea and percentage of single mother households in the United States with a correlation coefficient (R) of -0.152 and weighted average of 6.7%, a difference of 7.6%.
Single Mother Households Correlation Summary
| Measurement | Brazilian | Immigrants from Eritrea |
| Minimum | 1.3% | 0.57% |
| Maximum | 12.9% | 15.7% |
| Range | 11.6% | 15.2% |
| Mean | 6.1% | 6.5% |
| Median | 6.0% | 6.5% |
| Interquartile 25% (IQ1) | 4.9% | 5.0% |
| Interquartile 75% (IQ3) | 7.0% | 7.4% |
| Interquartile Range (IQR) | 2.1% | 2.4% |
| Standard Deviation (Sample) | 2.2% | 3.0% |
| Standard Deviation (Population) | 2.2% | 3.0% |
Similar Demographics by Single Mother Households
Demographics Similar to Brazilians by Single Mother Households
In terms of single mother households, the demographic groups most similar to Brazilians are Immigrants from Chile (6.3%, a difference of 0.090%), Puget Sound Salish (6.3%, a difference of 0.11%), Immigrants from Oceania (6.3%, a difference of 0.51%), Sri Lankan (6.2%, a difference of 0.57%), and Afghan (6.3%, a difference of 0.74%).
| Demographics | Rating | Rank | Single Mother Households |
| Iraqis | 73.0 /100 | #160 | Good 6.1% |
| Immigrants | Germany | 72.4 /100 | #161 | Good 6.1% |
| Immigrants | Zimbabwe | 69.9 /100 | #162 | Good 6.2% |
| Alsatians | 68.7 /100 | #163 | Good 6.2% |
| Immigrants | Northern Africa | 68.0 /100 | #164 | Good 6.2% |
| Immigrants | Syria | 67.4 /100 | #165 | Good 6.2% |
| Sri Lankans | 63.9 /100 | #166 | Good 6.2% |
| Brazilians | 59.1 /100 | #167 | Average 6.2% |
| Immigrants | Chile | 58.3 /100 | #168 | Average 6.3% |
| Puget Sound Salish | 58.1 /100 | #169 | Average 6.3% |
| Immigrants | Oceania | 54.6 /100 | #170 | Average 6.3% |
| Afghans | 52.5 /100 | #171 | Average 6.3% |
| Immigrants | South Eastern Asia | 52.2 /100 | #172 | Average 6.3% |
| Immigrants | Vietnam | 51.5 /100 | #173 | Average 6.3% |
| Immigrants | Morocco | 50.0 /100 | #174 | Average 6.3% |
Demographics Similar to Immigrants from Eritrea by Single Mother Households
In terms of single mother households, the demographic groups most similar to Immigrants from Eritrea are Immigrants from Venezuela (6.7%, a difference of 0.050%), Immigrants from Costa Rica (6.7%, a difference of 0.050%), Immigrants from Uruguay (6.7%, a difference of 0.16%), Nonimmigrants (6.7%, a difference of 0.63%), and Immigrants from Colombia (6.7%, a difference of 0.65%).
| Demographics | Rating | Rank | Single Mother Households |
| Cree | 11.9 /100 | #205 | Poor 6.7% |
| German Russians | 11.5 /100 | #206 | Poor 6.7% |
| Immigrants | South America | 11.5 /100 | #207 | Poor 6.7% |
| Vietnamese | 11.3 /100 | #208 | Poor 6.7% |
| Immigrants | Colombia | 10.5 /100 | #209 | Poor 6.7% |
| Immigrants | Nonimmigrants | 10.4 /100 | #210 | Poor 6.7% |
| Immigrants | Venezuela | 8.5 /100 | #211 | Tragic 6.7% |
| Immigrants | Eritrea | 8.4 /100 | #212 | Tragic 6.7% |
| Immigrants | Costa Rica | 8.2 /100 | #213 | Tragic 6.7% |
| Immigrants | Uruguay | 7.9 /100 | #214 | Tragic 6.7% |
| Shoshone | 5.7 /100 | #215 | Tragic 6.8% |
| Cherokee | 5.1 /100 | #216 | Tragic 6.8% |
| Aleuts | 4.8 /100 | #217 | Tragic 6.8% |
| Immigrants | Eastern Africa | 4.4 /100 | #218 | Tragic 6.8% |
| Immigrants | Immigrants | 4.3 /100 | #219 | Tragic 6.8% |